1953 Northern Ireland general election
The 1953 Northern Ireland general election was held on 22 October 1953. Like all previous elections to the Parliament of Northern Ireland, it produced a large majority for the Ulster Unionist Party.
| |||||||||||||||||||||||||||||||||||||||||||||||||||||||||||||||||||||||
All 52 seats to the House of Commons of Northern Ireland 27 seats were needed for a majority | |||||||||||||||||||||||||||||||||||||||||||||||||||||||||||||||||||||||
|---|---|---|---|---|---|---|---|---|---|---|---|---|---|---|---|---|---|---|---|---|---|---|---|---|---|---|---|---|---|---|---|---|---|---|---|---|---|---|---|---|---|---|---|---|---|---|---|---|---|---|---|---|---|---|---|---|---|---|---|---|---|---|---|---|---|---|---|---|---|---|---|
| |||||||||||||||||||||||||||||||||||||||||||||||||||||||||||||||||||||||
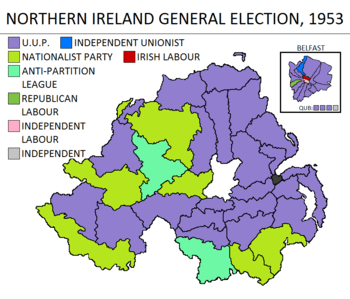 Election results by constituency | |||||||||||||||||||||||||||||||||||||||||||||||||||||||||||||||||||||||
| |||||||||||||||||||||||||||||||||||||||||||||||||||||||||||||||||||||||
Northern Ireland 1921–1972
|
|---|
| This article is part of a series on the politics and government of Northern Ireland 1921–1972 |
|
Government
|
|
Results
| 38 | 7 | 2 | 5 |
| UUP | Nationalist | AP | Oth |
| 1953 Northern Ireland general election | |||||||||||||||
|---|---|---|---|---|---|---|---|---|---|---|---|---|---|---|---|
| Party | Candidates | Votes | |||||||||||||
| Stood | Elected | Gained | Unseated | Net | % of total | % | No. | Net % | |||||||
| UUP | 43 | 38 | 3 | 2 | +1 | 73.1 | 48.6 | 125,379 | -14.1 | ||||||
| Independent Unionist | 8 | 1 | 1 | 2 | -1 | 1.9 | 12.8 | 32,998 | +12.2 | ||||||
| NI Labour | 9 | 0 | 0 | 0 | 0 | 12.1 | 31,360 | +5.0 | |||||||
| Nationalist | 8 | 7 | 0 | 2 | -2 | 13.5 | 10.8 | 27,796 | -16.0 | ||||||
| Irish Labour | 6 | 1 | 1 | 0 | +1 | 1.9 | 5.1 | 13,223 | N/A | ||||||
| Anti-Partition | 3 | 2 | 2 | 0 | +2 | 3.8 | 3.0 | 7,728 | N/A | ||||||
| Independent Irish Labour | 2 | 0 | 0 | 0 | 0 | 2.6 | 6,639 | N/A | |||||||
| Ind. Republican Labour | 1 | 1 | 1 | 0 | +1 | 1.9 | 2.3 | 5,947 | N/A | ||||||
| Independent Labour | 1 | 1 | 0 | 0 | 0 | 1.9 | 1.5 | 3,902 | -0.6 | ||||||
| Independent | 2 | 1 | 0 | 1 | -1 | 1.9 | 0.7 | 1,745 | +0.2 | ||||||
| Communist (NI) | 1 | 0 | 0 | 0 | 0 | 0.5 | 1,207 | +0.3 | |||||||
All parties shown. Electorate 888,352 (428,216 in contested seats); Turnout 60.2% (257,924).
Votes summary
Seats summary
See also
- MPs elected in the Northern Ireland general election, 1953
This article is issued from Wikipedia. The text is licensed under Creative Commons - Attribution - Sharealike. Additional terms may apply for the media files.