Waterfall plot
A waterfall plot is a three-dimensional plot in which multiple curves of data, typically spectra, are displayed simultaneously. Typically the curves are staggered both across the screen and vertically, with 'nearer' curves masking the ones behind. The result is a series of "mountain" shapes that appear to be side by side. The waterfall plot is often used to show how two-dimensional information changes over time or some other variable such as rpm. The term waterfall plot is sometimes used as a synonym of spectrogram or cumulative spectral decay (CSD) plot.
Uses
Waterfall plots are often used to show:
- the results of spectral density estimation, showing the spectrum of the signal at successive intervals of time.
- the delayed response from a loudspeaker or listening room produced by impulse response testing or MLSSA.
- spectra at different engine speeds when testing engines.
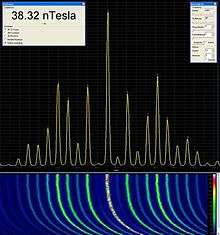
The upper half of this diagram shows the frequency spectrum of a modern switching power supply which employs spread spectrum. The lower half is a waterfall plot showing the variation of the frequency spectrum over time during the power supply's heating up period.
 Spectrogram and 3 styles of waterfall plot of a whistled sequence of 3 notes vs time
gollark: That isn't the halting problem and I disagree.
gollark: Regular polyhedra.
gollark: Do you know what that is?
gollark: They're meant to test some underlying general intelligence factor. Correlates quite well with stuff.
gollark: 55 would be ridiculous, that's 3 standard deviations.
This article is issued from Wikipedia. The text is licensed under Creative Commons - Attribution - Sharealike. Additional terms may apply for the media files.