Truro-Bible Hill-Millbrook-Salmon River
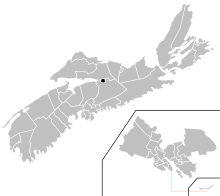
Truro-Bible Hill-Millbrook-Salmon River is a provincial electoral district in Nova Scotia, Canada, that elects one member to the Nova Scotia House of Assembly.
 | |||
| Provincial electoral district | |||
| Legislature | Nova Scotia House of Assembly | ||
| MLA |
Progressive Conservative | ||
| District created | 1978 | ||
| Last contested | 2020 | ||
| Demographics | |||
| Population (2011) | 20,144 | ||
| Electors | 15,656 | ||
| Area (km²) | 56.00 | ||
| Pop. density (per km²) | 359.7 | ||
| Census divisions | Colchester County | ||
| Census subdivisions | Colchester, Subd. B, Colchester, Subd. C, Millbrook 27, Truro | ||
The electoral district was created in 1978 and was named Truro-Bible Hill until it was renamed in the 2012 electoral boundary review; there were no boundary changes.
The present name for the electoral district was used beginning with the 2013 provincial election.
Members of the Legislative Assembly
The electoral district has elected the following Members of the Legislative Assembly:
| Legislature | Years | Member | Party | |
|---|---|---|---|---|
| Colchester prior to 1978 | ||||
| 52nd | 1978–1981 | Ron Giffin | Progressive Conservative | |
| 53rd | 1981–1984 | |||
| 54th | 1984–1988 | |||
| 55th | 1988–1993 | |||
| 56th | 1993–1998 | Eleanor Norrie | Liberal | |
| 57th | 1998–1999 | Jamie Muir | Progressive Conservative | |
| 58th | 1999–2003 | |||
| 59th | 2003–2006 | |||
| 60th | 2006–2009 | |||
| 61st | 2009-2013 | Lenore Zann | New Democratic | |
| 62nd | 2013–2017 | |||
| 63rd | 2017–2019 | |||
| 2019 | Independent | |||
| 2019-2020 | Vacant | |||
| 2020-present | Dave Ritcey | Progressive Conservative | ||
Election results
| Nova Scotia provincial by-election, March 10, 2020 Upon the resignation of Lenore Zann | ||||||||
|---|---|---|---|---|---|---|---|---|
| Party | Candidate | Votes | % | ±% | ||||
| Progressive Conservative | Dave Ritcey | 2,922 | 51.40 | +19.44 | ||||
| Liberal | Allan Kennedy | 1,385 | 24.36 | +0.27 | ||||
| New Democratic | Kathleen Kevany | 925 | 16.27 | -27.68 | ||||
| Green | Ivan Drouin | 398 | 7.00 | |||||
| Atlantica | Matthew Rushton | 55 | 0.97 | |||||
| Total valid votes | 5,685 | 99.61 | ||||||
| Total rejected ballots | 22 | 0.39 | -0.35 | |||||
| Turnout | 5,707 | 35.72 | -12.71 | |||||
| Eligible voters | 15,975 | |||||||
| Progressive Conservative gain from New Democratic | Swing | +23.56 | ||||||
2017 general election
| 2017 Nova Scotia general election | ||||||||
|---|---|---|---|---|---|---|---|---|
| Party | Candidate | Votes | % | ±% | ||||
| New Democratic | Lenore Zann | 3,455 | 43.95 | +5.90 | ||||
| Progressive Conservative | Keltie Jones | 2,512 | 31.96 | +2.26 | ||||
| Liberal | Craig Johnson | 1,894 | 24.09 | -8.15 | ||||
| Total valid votes | 7,861 | 99.27 | ||||||
| Total rejected ballots | 58 | 0.73 | -0.05 | |||||
| Turnout | 7,919 | 48.43 | -5.45 | |||||
| Eligible voters | 16,350 | |||||||
| New Democratic hold | Swing | +1.82 | ||||||
2013 general election
| Party | Candidate | Votes | % | ± | |
|---|---|---|---|---|---|
| New Democratic Party | Lenore Zann | 3,165 | 38.05 | -10.31 | |
| Liberal | Barry J. Mellish | 2,682 | 32.25 | +12.72 | |
| Progressive Conservative | Charles Cox | 2,470 | 29.70 | -0.53 | |
| Total valid votes | 8,317 | 99.21 | |||
| Total rejected ballots | 66 | 0.79 | +0.41 | ||
| Turnout | 8,383 | 53.89 | -0.10 | ||
| Eligible voters | 15,557 | ||||
| New Democratic hold | Swing | -11.52 | |||
2009 general election
| Party | Candidate | Votes | % | ± | |
|---|---|---|---|---|---|
| New Democratic Party | Lenore Zann | 4,070 | 48.37 | +19.73 | |
| Progressive Conservative | Hughie MacIsaac | 2,544 | 30.23 | -17.04 | |
| Liberal | Bob Hagell | 1,643 | 19.52 | -1.80 | |
| Green | Kaleigh Brinkhurst | 158 | 1.88 | -0.89 | |
| Total valid votes | 8,415 | 99.62 | |||
| Total rejected ballots | 32 | 0.38 | +0.05 | ||
| Turnout | 8,447 | 53.98 | +0.92 | ||
| Eligible voters | 15,647 | ||||
| New Democratic gain from Progressive Conservative | Swing | +18.39 | |||
2006 general election
| Party | Candidate | Votes | % | ± | |
|---|---|---|---|---|---|
| Progressive Conservative | Jamie Muir | 3,711 | 47.27 | +0.16 | |
| New Democratic Party | Jim Harpell | 2,248 | 28.64 | +0.41 | |
| Liberal | Ron Chisholm | 1,674 | 21.32 | -3.33 | |
| Green | Barton Cutten | 217 | 2.76 | – | |
| Total valid votes | 7,850 | 99.67 | |||
| Total rejected ballots | 26 | 0.33 | -0.18 | ||
| Turnout | 7,876 | 53.06 | -4.15 | ||
| Eligible voters | 14,843 | ||||
| Progressive Conservative hold | Swing | -0.12 | |||
2003 general election
| Party | Candidate | Votes | % | ± | |
|---|---|---|---|---|---|
| Progressive Conservative | Jamie Muir | 3,862 | 47.11 | -6.47 | |
| New Democratic Party | Jim Harpell | 2,314 | 28.23 | +0.02 | |
| Liberal | Jeff Yuill | 2,021 | 24.66 | +6.45 | |
| Total valid votes | 8,197 | 99.49 | |||
| Total rejected ballots | 42 | 0.51 | -0.07 | ||
| Turnout | 8,239 | 57.21 | -7.80 | ||
| Eligible voters | 14,401 | ||||
| Progressive Conservative hold | Swing | -3.25 | |||
1999 general election
| Party | Candidate | Votes | % | ± | |
|---|---|---|---|---|---|
| Progressive Conservative | Jamie Muir | 4,747 | 53.58 | +11.55 | |
| New Democratic Party | Ibel Scammell | 2499 | 28.21 | -1.82 | |
| Liberal | Matthew Graham | 1,613 | 18.21 | -9.73 | |
| Total valid votes | 8,859 | 99.42 | |||
| Total rejected ballots | 52 | 0.58 | +0.18 | ||
| Turnout | 8,911 | 65.01 | +1.42 | ||
| Eligible voters | 13,707 | ||||
| Progressive Conservative hold | Swing | +6.69 | |||
1998 general election
| 1998 Nova Scotia general election | ||||||||
|---|---|---|---|---|---|---|---|---|
| Party | Candidate | Votes | % | ±% | ||||
| Progressive Conservative | Jamie Muir | 3,852 | 42.03 | +3.67 | ||||
| New Democratic | Ibel Scammell | 2,752 | 30.03 | +8.49 | ||||
| Liberal | Eleanor Norrie | 2,560 | 27.94 | -12.16 | ||||
| Total valid votes | 9,164 | 99.60 | ||||||
| Total rejected ballots | 37 | 0.40 | -0.33 | |||||
| Turnout | 9,201 | 63.60 | -9.87 | |||||
| Eligible voters | 14,468 | |||||||
| Progressive Conservative gain from Liberal | Swing | +7.92 | ||||||
1993 general election
| 1993 Nova Scotia general election | ||||||||
|---|---|---|---|---|---|---|---|---|
| Party | Candidate | Votes | % | ±% | ||||
| Liberal | Eleanor Norrie | 4,321 | 40.10 | +0.90 | ||||
| Progressive Conservative | Jack Coupar | 4,134 | 38.36 | -12.07 | ||||
| New Democratic | Rick Bowden | 2,321 | 21.54 | +11.27 | ||||
| Total valid votes | 10,776 | 99.27 | ||||||
| Total rejected ballots | 79 | 0.73 | -0.31 | |||||
| Turnout | 10,855 | 73.46 | +0.86 | |||||
| Eligible voters | 14,776 | |||||||
| Liberal gain from Progressive Conservative | Swing | +6.44 | ||||||
1988 general election
| 1988 Nova Scotia general election | ||||||||
|---|---|---|---|---|---|---|---|---|
| Party | Candidate | Votes | % | ±% | ||||
| Progressive Conservative | Ron Giffin | 4,479 | 50.43 | -10.60 | ||||
| Liberal | Kirby Eileen Grant | 3,490 | 39.30 | +11.84 | ||||
| New Democratic | Carol Martin | 912 | 10.27 | -1.25 | ||||
| Total valid votes | 8,881 | 99.59 | ||||||
| Total rejected ballots | 37 | 0.41 | -0.01 | |||||
| Turnout | 8,918 | 72.60 | +9.30 | |||||
| Eligible voters | 12,283 | |||||||
| Progressive Conservative hold | Swing | -11.22 | ||||||
1984 general election
| 1984 Nova Scotia general election | ||||||||
|---|---|---|---|---|---|---|---|---|
| Party | Candidate | Votes | % | ±% | ||||
| Progressive Conservative | Ron Giffin | 5,008 | 61.03 | -0.53 | ||||
| Liberal | Kirby Grant | 2,253 | 27.46 | +1.76 | ||||
| New Democratic | Andy Belliveau | 945 | 11.52 | -1.24 | ||||
| Total valid votes | 8,206 | 99.58 | ||||||
| Total rejected ballots | 35 | 0.42 | -0.09 | |||||
| Turnout | 8,241 | 63.30 | -5.87 | |||||
| Eligible voters | 13,019 | |||||||
| Progressive Conservative hold | Swing | -1.14 | ||||||
1981 general election
| 1981 Nova Scotia general election | ||||||||
|---|---|---|---|---|---|---|---|---|
| Party | Candidate | Votes | % | ±% | ||||
| Progressive Conservative | Ron Giffin | 5,024 | 61.55 | +6.31 | ||||
| Liberal | Sylvia Roy | 2,097 | 25.69 | -11.34 | ||||
| New Democratic | Tom Barron | 1,041 | 12.75 | +5.85 | ||||
| Total valid votes | 8,162 | 99.49 | ||||||
| Total rejected ballots | 42 | 0.51 | +0.01 | |||||
| Turnout | 8,204 | 69.17 | -5.74 | |||||
| Eligible voters | 11,861 | |||||||
| Progressive Conservative hold | Swing | +8.83 | ||||||
1978 general election
| 1978 Nova Scotia general election | ||||||||
|---|---|---|---|---|---|---|---|---|
| Party | Candidate | Votes | % | |||||
| Progressive Conservative | Ron Giffin | 4,713 | 55.24 | |||||
| Liberal | Peter Wilson | 3,160 | 37.04 | |||||
| New Democratic | Thomas Barron | 589 | 6.90 | |||||
| Independent | Bob Kirk | 70 | 0.82 | |||||
| Total valid votes | 8,532 | 99.50 | ||||||
| Total rejected ballots | 43 | 0.50 | ||||||
| Turnout | 8,575 | 74.90 | ||||||
| Eligible voters | 11,448 | |||||||
gollark: I mean, anyhow, lazy_static, smallvec, anyhow, thiserror, and regex could maybe be in the standard library.
gollark: It MIGHT be.
gollark: A shame. Which ones should I be using?
gollark: You will be rewarded.
gollark: That was very helpful.
External links
This article is issued from Wikipedia. The text is licensed under Creative Commons - Attribution - Sharealike. Additional terms may apply for the media files.