Tropical cyclone track forecasting
Tropical cyclone track forecasting involves predicting where a tropical cyclone is going to track over the next five days, every 6 to 12 hours. The history of tropical cyclone track forecasting has evolved from a single-station approach to a comprehensive approach which uses a variety of meteorological tools and methods to make predictions. The weather of a particular location can show signs of the approaching tropical cyclone, such as increasing swell, increasing cloudiness, falling barometric pressure, increasing tides, squalls, and heavy rainfall.

The forces that affect tropical cyclone steering are the higher-latitude westerlies, the subtropical ridge, and the beta effect caused by changes of the coriolis force within fluids such as the atmosphere. Accurate track predictions depend on determining the position and strength of high- and low-pressure areas, and predicting how those areas will migrate during the life of a tropical system. Computer forecast models are used to help determine this motion as far out as five to seven days in the future.
History
The methods through which tropical cyclones are forecast have changed with the passage of time. The first known forecasts in the Western Hemisphere were made by Lt. Col. William Reed of the Corps of Royal Engineers at Barbados in 1847. Reed mostly utilized barometric pressure measurements as the basis of his forecasts. Benito Viñes, S.J., introduced a forecast and warning system based on cloud cover changes in Havana during the 1870s. Forecasting hurricane motion was based on tide movements, as well as cloud and barometer changes over time. In 1895, it was noted that cool conditions with unusually high pressure preceded tropical cyclones in the West Indies by several days. Before the early 1900s, most forecasts were done by direct observations at weather stations, which were then relayed to forecast centers via telegraph. It was not until the advent of radio in the early twentieth century that observations from ships at sea were available to forecasters. Despite the issuance of hurricane watches and warnings for systems threatening the coast, forecasting the path of tropical cyclones did not occur until 1920.[1] By 1922, it was known that the winds at 3 kilometres (9,800 ft) to 4 kilometres (13,000 ft) in height above the sea surface within the storms' right front quadrant were representative of a storm's steering, and that hurricanes tended to follow the outermost closed isobar of the subtropical ridge.[2]
In 1937, radiosondes were used to aide tropical cyclone forecasting.[2] The next decade saw the advent of aircraft-based reconnaissance by the military, starting with the first dedicated flight into a hurricane in 1943, and the establishment of the Hurricane Hunters in 1944. In the 1950s, coastal weather radars began to be used in the United States, and research reconnaissance flights by the precursor of the Hurricane Research Division began in 1954.[3] The launch of the first weather satellite, TIROS-I, in 1960, introduced new techniques to tropical cyclone forecasting that remain important to the present day. In the 1970s, buoys were introduced to improve the resolution of surface measurements, which until that point, were not available at all over sea surfaces.[3]
Single station forecasting of a tropical cyclone passage

About four days in advance of a typical tropical cyclone, an ocean of 1 metre (3.3 ft) in height will roll in about every 10 seconds, moving towards the coast from the direction of the tropical cyclone's location. The ocean swell will slowly increase in height and frequency the closer a tropical cyclone gets to land. Two days in advance of the center's passage, winds go calm as the tropical cyclone interrupts the environmental wind flow. Within 36 hours of the center passage, the pressure begins to fall and a veil of white cirrus clouds approaches from the cyclone's direction. Within 24 hours of the closest approach to the center, low clouds begin to move in, also known as the bar of a tropical cyclone, as the barometric pressure begins to fall more rapidly and the winds begin to increase. Within 18 hours of the center's approach, squally weather is common, with sudden increases in wind accompanied by rain showers or thunderstorms. Winds increase within 12 hours of the center's approach, occasionally reaching hurricane force. The ocean's surface becomes whipped with foam. Small items begin flying in the wind. Within 6 hours of the center's arrival, rain becomes continuous and the storm surge begins to come inland. Within an hour of the center, the rain becomes very heavy and the highest winds within the tropical cyclone are experienced. When the center arrives with a strong tropical cyclone, weather conditions improve and the sun becomes visible as the eye moves overhead. At this point, the pressure ceases to drop as the lowest pressure within the storm's center is reached. This is also when the peak depth of the storm surge occurs. Once the system departs, winds reverse and, along with the rain, suddenly increase. The storm surge retreats as the pressure suddenly rises in the wake of its center. One day after the center's passage, the low overcast is replaced with a higher overcast, and the rain becomes intermittent. By 36 hours after the center's passage, the high overcast breaks and the pressure begins to level off.[4]
Basics
The large scale synoptic scale flow determines 70 to 90 percent of a tropical cyclone's motion. The deep-layered mean flow through the troposphere is considered to be the best tool in determining track direction and speed. If storms experience significant vertical wind shear, use of a lower level wind such as the 700 hPa pressure level (at a height of 3,000 metres (9,800 ft) above sea level) will work out as a better predictor. Knowledge of the beta effect can be used to steer a tropical cyclone, since it leads to a more northwest heading for tropical cyclones in the Northern Hemisphere due to differences in the coriolis force around the cyclone.[5] For example, the beta effect will allow a tropical cyclone to track poleward and slightly to the right of the deep layer steering flow while the system lies the south of the subtropical ridge. Northwest moving storms move quicker and left, while northeast moving storms move slower and left. The larger the cyclone, the larger the impact of the beta effect is likely to be.[6]

Fujiwhara effect
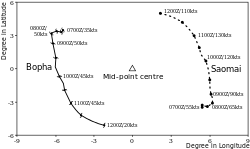
When two or more tropical cyclones are in proximity to one another, they begin to rotate cyclonically around the midpoint between their circulation centers. In the northern hemisphere, this is in a counterclockwise direction, and in the southern hemisphere, a clockwise direction. Usually, the tropical cyclones need to be within 1,450 kilometres (900 mi) of each other for this effect to take place. It is a more common phenomenon in the northern Pacific Ocean than elsewhere, due to the higher frequency of tropical cyclone activity which occurs in that region.[7]
Trochoidal motions
Small wobbles in a tropical cyclone's track can occur when the convection is distributed unevenly within its circulation. This can be due to changes in vertical wind shear or inner core structure.[7] Because of this effect, forecasters use a longer term (6 to 24 hours) motion to help forecast tropical cyclones, which acts to smooth out such wobbles.[6]
Forecast models

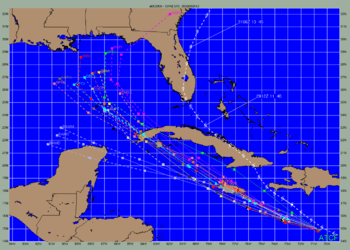
High-speed computers and sophisticated simulation software allow meteorologists to run computer models that forecast tropical cyclone tracks based on the future position and strength of high- and low-pressure systems. Combining forecast models with increased understanding of the forces that act on tropical cyclones, and a wealth of data from Earth-orbiting satellites and other sensors, scientists have increased the accuracy of track forecasts over recent decades.[8] The addition of dropwindsonde missions around tropical cyclones in what are known as synoptic flow missions in the Atlantic Basin decreased track error by 15–20 percent.[9] Using a consensus of forecast models, as well as ensemble members of the various models, can help reduce forecast error.[7] However, regardless how small the average error becomes, large errors within the guidance are still possible.[10] An accurate track forecast is important, because if the track forecast is incorrect, forecasts for intensity, rainfall, storm surge, and tornado threat will also be incorrect.
Length of forecast period
Forecasts within hurricane advisories were issued one day into the future in 1954 before being extended to two days into the future in 1961, and three days into the future in 1964.[11] Starting in the mid to late 1990s, research into tropical cyclones and how forecast models handle the systems led to substantial improvements in track error.[12] By 2001, the error had reduced sufficiently to extend track out to 5 days in the future on public advisories. In addition, at 1700 UTC during the hurricane season, a medium-range coordination call takes place between the Hydrometeorological Prediction Center and the National Hurricane Center to coordinate tropical cyclone placement on the medium-range pressure forecasts 6 and 7 days into the future for the northeast Pacific and Atlantic basins. Every so often, even at this time range, successful predictions can be made.[13]
In forecasts, the National Hurricane Center uses a track forecast cone for the graphical representation of the uncertainty in its forecasts of a tropical cyclone's future location. The cone represents the probable position of a tropical cyclone's circulation center, and is made by drawing a set of circles centered at each forecast point—12, 24, 36, 48, and 72 hours for a three-day forecast, as well as 96 and 120 hours for a five-day forecast. The radius of each circle is equal to encompass two-thirds of the historical official forecast errors for the preceding five-year period. The cone is then constructed by drawing a tangent line that connects the outside boundary of all the circles. The National Hurricane Center states that the entire track of the tropical cyclone "can be expected to remain within the cone roughly 60–70% of the time."[14]
See also
References
- William J. Kotsch (1983). Weather For the Mariner. Naval Institute Press. pp. 18–19. ISBN 9780870217562. Retrieved 2012-04-29.
- Staff (June 1959). "WB Hurricane Forecasting Service" (PDF). Weather Bureau Topics. United States Weather Bureau: 102–104. Retrieved 2012-04-22.
- Robert C. Sheets (June 1990). "The National Hurricane Center—Past, Present and Future". Weather and Forecasting. 5 (2): 185–232. Bibcode:1990WtFor...5..185S. doi:10.1175/1520-0434(1990)005<0185:TNHCPA>2.0.CO;2.
- Central Pacific Hurricane Center. Tropical Cyclone Observations. Retrieved on 2008-05-05.
- Glossary of Meteorology. Beta Effect. Archived 2011-06-06 at the Wayback Machine Retrieved on 2008-05-05.
- U. S. Navy. SECTION 1. INFLUENCES ON TROPICAL CYCLONE MOTION. Retrieved on 2007-04-10.
- Todd Kimberlain. Tropical cyclone motion and intensity talk (June 2007). Retrieved on 2007-07-21.
- National Hurricane Center (May 22, 2006). "Annual average model track errors for Atlantic basin tropical cyclones for the period 1994–2005, for a homogeneous selection of "early" models". National Hurricane Center Forecast Verification. National Oceanic and Atmospheric Administration. Retrieved 2006-11-30.
- B. Geerts. Tropical cyclone track forecasting. Retrieved on 2007-04-10.
- Richard J. Pasch, Mike Fiorino, and Chris Landsea (2006). TPC/NHC'S Review of the NCEP Production Suite For 2006. Environmental Modeling Center.
- James Franklin (2012-03-01). "National Hurricane Center Forecast Verification". National Hurricane Center. p. 2. Retrieved 2012-04-19.
- James Franklin (2012-03-01). Forecast verification trends over the past 35 years. National Hurricane Center. p 6. Retrieved on 2007-05-05.
- Department of Commerce (2006). Hurricane Katrina Service Assessment. Archived 2007-07-11 at the Wayback Machine National Weather Service. Retrieved on 2007-05-05.
- National Hurricane Center (2008). "Definition of the NHC Track Forecast Cone". National Oceanic and Atmospheric Administration. Retrieved 2008-08-27.