Texas's 18th congressional district
Texas's 18th congressional district of the United States House of Representatives includes much of inner city Houston and the surrounding area. It has been the Downtown Houston district since 1972. The current Representative from the 18th district is Sheila Jackson Lee.
| Texas's 18th congressional district | |||
|---|---|---|---|
.tif.png) Texas's 18th congressional district - since January 3, 2013. | |||
| Representative |
| ||
| Distribution |
| ||
| Population (2016) | 787,352[2] | ||
| Median income | $45,584[3] | ||
| Ethnicity |
| ||
| Cook PVI | D+27[4] | ||
It was held by Barbara Jordan, the first black woman elected to Congress from the South (in 1972), who was praised by many for her powerful presence in that body, and in particular, for her oratory skills.[5]
Since the district was moved to Houston in 1972, it has voted for a Democrat in every presidential election. The district gave George McGovern 69% in 1972 and Walter Mondale 72% in 1984.
List of representatives
| Representative | Party | Years | Cong ress |
Note |
|---|---|---|---|---|
| District created | March 4, 1919 | |||
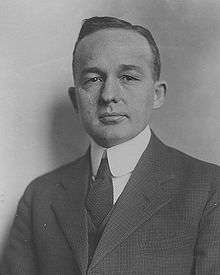 |
Democratic | March 4, 1919 - November 20, 1940 | 66th 67th 68th 69th 70th 71st 72nd 73rd 74th 75th 76th |
Redistricted from the 13th district, Resigned after being appointed judge of the US Court of Claims |
| Vacant | November 20, 1940 – January 3, 1941 | |||
 |
Democratic | January 3, 1941 - April 3, 1950 | 77th 78th 79th 80th 81st |
Resigned after being appointed judge of the US Court of Customs and Patent Appeals |
 |
Republican | May 6, 1950 – January 3, 1951 | 81st | Won special election on May 6, 1950 |
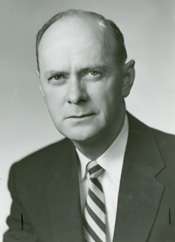 |
Democratic | January 3, 1951 - January 3, 1967 | 82nd 83rd 84th 85th 86th 87th 88th 89th |
|
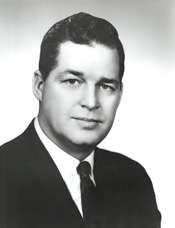 |
Republican | January 3, 1967 - January 3, 1973 | 90th 91st 92nd |
Redistricted to the 13th district |
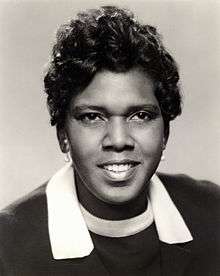 |
Democratic | January 3, 1973 - January 3, 1979 | 93rd 94th 95th |
|
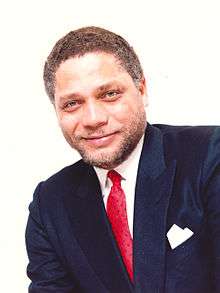 |
Democratic | January 3, 1979 - August 7, 1989 | 96th 97th 98th 99th 100th 101st |
Died |
| Vacant | August 7, 1989 – December 9, 1989 | |||
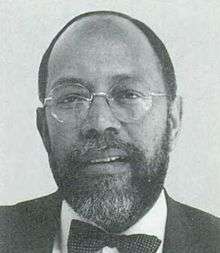 |
Democratic | December 9, 1989 - January 3, 1995 | 101st 102nd 103rd |
|
| Democratic | January 3, 1995 – Present | 104th 105th 106th 107th 108th 109th 110th 111th 112th 113th 114th 115th 116th |
Incumbent | |
Election results
| Party | Candidate | Votes | % | |
|---|---|---|---|---|
| Democratic | Sheila Jackson Lee (incumbent) | 138,704 | 75.3 | |
| Republican | Ava Reynero Pate | 38,368 | 20.8 | |
| Libertarian | Luke Spencer | 4,067 | 2.2 | |
| Independent | Vince Duncan | 3,193 | 1.7 | |
| Total votes | 184,332 | 100.0 | ||
| Democratic hold | ||||
| Party | Candidate | Votes | % | ± | |
|---|---|---|---|---|---|
| Democratic | Sheila Jackson Lee | 150,157 | 73.50 | ||
| Republican | Lori Bartley | 48,306 | 23.64 | ||
| Green | Thomas Kleven | 5,845 | 2.86 | ||
| Majority | 101,851 | 49.85 | |||
| Turnout | 204,308 | 55.96 | |||
| Democratic hold | Swing | ||||
| Party | Candidate | Votes | % | ± | |
|---|---|---|---|---|---|
| Democratic | Sheila Jackson Lee | 76,097 | 71.78 | ||
| Republican | Sean Seibert | 26,249 | 24.76 | ||
| Green | Remington Alessi | 1,302 | 1.23 | ||
| Independent | Vince Duncan | 2,376 | 2.23 | ||
| Majority | 49,848 | 47.02 | |||
| Turnout | 106,010 | 30.60 | |||
| Democratic hold | Swing | ||||
| Party | Candidate | Votes | % | ± | |
|---|---|---|---|---|---|
| Democratic | Sheila Jackson Lee | 146,223 | 75.01 | ||
| Republican | Sean Seibert | 44,015 | 22.58 | ||
| Libertarian | Christopher Barber | 4,694 | 2.41 | ||
| Majority | 102,208 | 52.43 | |||
| Turnout | 194,932 | 58.79 | |||
| Democratic hold | Swing | ||||
| Party | Candidate | Votes | % | ± | |
|---|---|---|---|---|---|
| Democratic | Sheila Jackson Lee | 85,108 | 70.15 | ||
| Republican | John Faulk | 33,067 | 27.26 | ||
| Libertarian | Mike Taylor | 3,118 | 2.57 | ||
| Independent | Charles B. Meyer (Write-in) | 28 | 0.02 | ||
| Majority | 52,041 | 42.89 | |||
| Turnout | 125,968 | 36.73 | |||
| Democratic hold | Swing | ||||
| Party | Candidate | Votes | % | ± | |
|---|---|---|---|---|---|
| Democratic | Sheila Jackson Lee | 148,617 | 77.32 | ||
| Republican | John Faulk | 39,095 | 20.34 | ||
| Libertarian | Mike Taylor | 4,486 | 2.33 | ||
| Majority | 109,522 | 56.98 | |||
| Turnout | 192,295 | 82.5 | |||
| Democratic hold | Swing | ||||
In popular culture
In the TV series The West Wing, Texas's 18th congressional district was represented by fictional Democratic presidential candidate Matt Santos.
Historical district boundaries
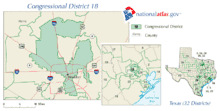
References
- https://www.census.gov/geo/maps-data/data/cd_state.html
- https://www.census.gov/mycd/?st=48&cd=18
- https://www.census.gov/mycd/?st=48&cd=18
- "Partisan Voting Index – Districts of the 115th Congress" (PDF). The Cook Political Report. April 7, 2017. Retrieved April 7, 2017.
- "Before Things Went to Hell". This American Life.
- "Texas Election Results". Texas Secretary of State. Retrieved December 5, 2018.
- Martis, Kenneth C. (1989). The Historical Atlas of Political Parties in the United States Congress. New York: Macmillan Publishing Company.
- Martis, Kenneth C. (1982). The Historical Atlas of United States Congressional Districts. New York: Macmillan Publishing Company.
- Congressional Biographical Directory of the United States 1774–present