Texas's 17th congressional district
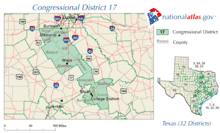
Texas's 17th congressional district of the United States House of Representatives includes a strip of central Texas stretching from Waco to Bryan-College Station, including former President George W. Bush's McLennan County ranch.[5][6] The district is currently represented by Republican Bill Flores.
| Texas's 17th congressional district | |||
|---|---|---|---|
.tif.png) Texas's 17th congressional district – since January 3, 2013. | |||
| Representative |
| ||
| Distribution |
| ||
| Population (2016) | 761,922[2] | ||
| Median income | $51,036[3] | ||
| Ethnicity |
| ||
| Cook PVI | R+12[4] | ||
From 2005 to 2013, it was an oblong district stretching from south of Tarrant County to Grimes County in the southeast. The 2012 redistricting made its area more square, removing the northern and southeastern portions, adding areas southwest into the northern Austin suburbs and east into Freestone and Leon counties. The district includes two major universities, Texas A&M University in College Station and Baylor University in Waco.
Before 2005, the district stretched from the Abilene area to the outer western fringes of the Dallas-Fort Worth Metroplex.
Representation
After the 2003 Texas redistricting, engineered by former House Majority Leader Tom DeLay, TX-17 was (along with MS-4) the most heavily Republican district in the nation to be represented by a Democrat, according to the Cook Partisan Voting Index, which rated it R+20.[7] The district was drawn to make it Republican-dominated and unseat its longtime incumbent, conservative Democrat Chet Edwards. While several of his colleagues were defeated by Republicans in 2004, Edwards held on to the seat in the 2004, 2006 and 2008 elections.
But in the 2010 Congressional elections, the district elected Republican Bill Flores over Edwards by a margin of 61.8% to 36.6%.[8] Flores was the first Republican to be elected to represent the district since its creation in 1919. This reflected the disfranchisement of minority voters at the turn of the century, and the Solid South political dominance of the Democratic Party, which was long made up of white conservatives in Texas. At that time white conservatives predominately belonged to the Democratic Party. They dominated that district by population and by suppressing Republican opposition among its minority supporters.
After passage of civil rights legislation and other changes, through the late 20th and early 21st centuries, white conservatives began to shift into the Republican Party in Texas. They first supported presidential candidates, and gradually more Republicans for local, state and national office, resulting in Flores's victory.
List of members representing the district
| Member (Residence) |
Party | Years | Cong ess |
Electoral history |
|---|---|---|---|---|
| District created | March 4, 1919 | |||
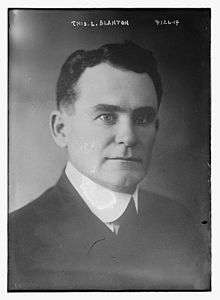 Thomas L. Blanton (Abilene) |
Democratic | March 4, 1919 – March 3, 1929 |
66th 67th 68th 69th 70th |
Redistricted from the 16th district and re-elected in 1918. Re-elected in 1920. Re-elected in 1922. Re-elected in 1924. Re-elected in 1926. Retired to run for U.S. Senator (lost nomination). |
.jpg) Robert Q. Lee (Cisco) |
Democratic | March 4, 1929 – April 18, 1930 |
71st | Elected in 1928. Died. |
| Vacant | April 18, 1930 – May 20, 1930 | |||
 Thomas L. Blanton (Abilene) |
Democratic | May 20, 1930 – January 3, 1937 |
71st 72nd 73rd 74th |
Elected to finish Lee's term. Re-elected in 1932. Re-elected in 1934. Lost renomination. |
 Clyde L. Garrett (Eastland) |
Democratic | January 3, 1937 – January 3, 1941 |
75th 76th |
Elected in 1936. Re-elected in 1938. Lost renomination. |
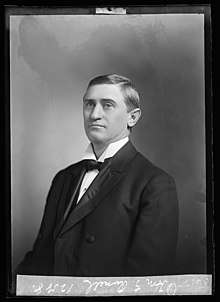 Sam M. Russell (Stephenville) |
Democratic | January 3, 1941 – January 3, 1947 |
77th 78th 79th |
Elected in 1940. Re-elected in 1942. Re-elected in 1944. Retired. |
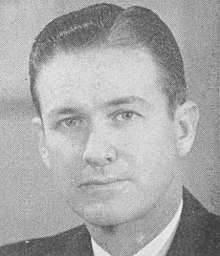 Omar Burleson (Anson) |
Democratic | January 3, 1947 – December 31, 1978 |
80th 81st 82nd 83rd 84th 85th 86th 87th 88th 89th 90th 91st 92nd 93rd 94th 95th |
Elected in 1946. Re-elected in 1948. Re-elected in 1950. Re-elected in 1952. Re-elected in 1954. Re-elected in 1956. Re-elected in 1958. Re-elected in 1960. Re-elected in 1962. Re-elected in 1964. Re-elected in 1966. Re-elected in 1968. Re-elected in 1970. Re-elected in 1972. Re-elected in 1974. Re-elected in 1976. Retired then resigned. |
| Vacant | December 31, 1978 – January 3, 1979 |
95th | ||
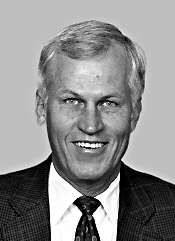 Charles Stenholm (Abilene) |
Democratic | January 3, 1979 – January 3, 2005 |
96th 97th 98th 99th 100th 101st 102nd 103rd 104th 105th 106th 107th 108th |
Elected in 1978. Re-elected in 1980. Re-elected in 1982. Re-elected in 1984. Re-elected in 1986. Re-elected in 1988. Re-elected in 1990. Re-elected in 1992. Re-elected in 1994. Re-elected in 1996. Re-elected in 1998. Re-elected in 2000. Re-elected in 2002. Redistricted to the 19th district and lost re-election. |
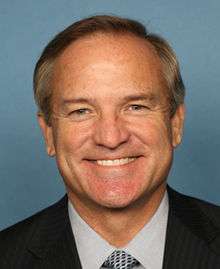 Chet Edwards (Waco) |
Democratic | January 3, 2005 – January 3, 2011 |
109th 110th 111th |
Redistricted from the 11th district and re-elected in 2004. Re-elected in 2006. Re-elected in 2008. Lost re-election. |
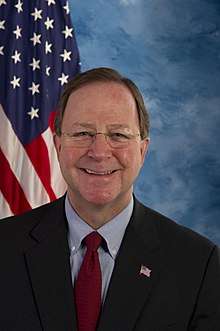 Bill Flores (Bryan) |
Republican | January 3, 2011 – present |
112th 113th 114th 115th 116th |
Elected in 2010. Re-elected in 2012. Re-elected in 2014. Re-elected in 2016. Re-elected in 2018. |
Election results
| Party | Candidate | Votes | % | ± | |
|---|---|---|---|---|---|
| Republican | Bill Flores | 134,841 | 56.8 | -4.01 | |
| Democratic | Rick Kennedy | 98,070 | 41.3 | +6.06 | |
| Libertarian | Clark Patterson | 4,440 | 1.9 | -2.05 | |
| Majority | 36,771 | 15.5 | |||
| Turnout | 237,351 | ||||
| Party | Candidate | Votes | % | ± | |
|---|---|---|---|---|---|
| Republican | Bill Flores | 149,417 | 60.81 | -3.77 | |
| Democratic | William Matta | 86,603 | 35.24 | +2.84 | |
| Libertarian | Clark Patterson | 9,708 | 3.95 | +0.93 | |
| Majority | 53,106 | 21.6 | |||
| Turnout | 245,728 | ||||
| Party | Candidate | Votes | % | ± | |
|---|---|---|---|---|---|
| Republican | Bill Flores | 85,807 | 64.58 | -15.35 | |
| Democratic | Nick Haynes | 43,049 | 32.4 | ||
| Libertarian | Shawn Michael Hamilton | 4,009 | 3.02 | -17.05 | |
| Majority | 38,749 | 29.16 | |||
| Turnout | 132,865 | ||||
| Party | Candidate | Votes | % | ± | |
|---|---|---|---|---|---|
| Republican | Bill Flores | 143,284[9] | 79.93 | +34.8 | |
| Libertarian | Ben Easton | 35,978 | 20.07 | 119 | |
| Majority | 107,306 | ||||
| Turnout | 179,262 | 4.23 | |||
| Party | Candidate | Votes | % | ± | |
|---|---|---|---|---|---|
| Republican | Bill Flores | 106,275 | 61.79 | +16.28 | |
| Democratic | Chet Edwards | 62,926 | 36.59 | -16.39 | |
| Libertarian | Richard Kelly | 2,787 | 1.62 | +0.11 | |
| Majority | 43,349 | 25.2 | +17.73 | ||
| Turnout | 171,988 | ||||
| Republican gain from Democratic | Swing | +16.34 | |||
| Party | Candidate | Votes | % | ± | |
|---|---|---|---|---|---|
| Democratic | Chet Edwards | 134,592 | 52.98 | -5.14 | |
| Republican | Rob Curnock | 115,581 | 45.51 | +5.21 | |
| Libertarian | Gardner C. Osbourne | 3,849 | 1.51 | -0.07 | |
| Majority | 19,011 | 7.47 | -10.35 | ||
| Turnout | 254,022 | ||||
| Democratic hold | Swing | -5.18 | |||
| Party | Candidate | Votes | % | ± | |
|---|---|---|---|---|---|
| Democratic | Chet Edwards | 92,478 | 58.12 | +6.92 | |
| Republican | Van Taylor | 64,142 | 40.30 | -7.11 | |
| Libertarian | Guillermo Acosta | 2,504 | 1.58 | +0.19 | |
| Majority | 28,336 | 17.82 | +14.03 | ||
| Turnout | 159,124 | ||||
| Democratic hold | Swing | +7.02 | |||
| Party | Candidate | Votes | % | ± | |
|---|---|---|---|---|---|
| Democratic | Chet Edwards | 125,309 | 51.20 | -0.17 | |
| Republican | Arlene Wohlgemuth | 116,049 | 47.41 | +0.03 | |
| Libertarian | Clyde Garland | 3,390 | 1.39 | +0.14 | |
| Majority | 9,260 | 3.79 | -0.19 | ||
| Turnout | 244,748 | ||||
| Democratic hold | Swing | -0.1 | |||
| Party | Candidate | Votes | % | ± | |
|---|---|---|---|---|---|
| Democratic | Charlie Stenholm | 84,136 | 51.37 | ||
| Republican | Rob Beckham | 77,622 | 47.38 | ||
| Libertarian | Fred Jones | 2,046 | 1.25 | ||
| Majority | 6,514 | 3.98 | |||
| Turnout | 163,804 | ||||
| Democratic hold | Swing | ||||
Historical district boundaries
References
- Geography, US Census Bureau. "Congressional Districts Relationship Files (state-based)". www.census.gov.
- Bureau, Center for New Media & Promotion (CNMP), US Census. "My Congressional District". www.census.gov.
- Center for New Media & Promotion (CNMP), US Census Bureau. "My Congressional District". www.census.gov.
- "Partisan Voting Index – Districts of the 115th Congress" (PDF). The Cook Political Report. April 7, 2017. Retrieved April 7, 2017.
- "Pelosi continues to tout Texas Rep. Chet Edwards for VP". Texas on the Potomac (blog). Houston Chronicle. August 3, 2008. Retrieved October 21, 2012.
- Vlahos, Kelley (March 7, 2006). "Texas Rep. Edwards Beats Odds, but Faces Iraq War Vet in Midterm". Fox News. Retrieved March 25, 2007.
- Texas 17th District Profile Congressional Quarterly. May 14, 2010.
- 2010 Texas Election Results New York Times. November 13, 2010.
- United States House of Representatives elections in Texas, 2012#District 17
Sources
- Martis, Kenneth C. (1989). The Historical Atlas of Political Parties in the United States Congress. New York: Macmillan Publishing Company.
- Martis, Kenneth C. (1982). The Historical Atlas of United States Congressional Districts. New York: Macmillan Publishing Company.
- Congressional Biographical Directory of the United States 1774–present