Stratford-on-Avon District Council elections
One third of Stratford-on-Avon District Council in Warwickshire, England is elected each year, followed by one year without election. Since the last boundary changes in 2002, 53 councillors have been elected from 31 wards.[1]
Political control
Since the foundation of the council in 1973 political control of the council has been held by the following parties:[2][3]
| Party in control | Years |
|---|---|
| Independent | 1973 - 1976 |
| No overall control | 1976 - 1979 |
| Conservative | 1979 - 1991 |
| No overall control | 1991 - 1992 |
| Conservative | 1992 - 1994 |
| No overall control | 1994 - 2000 |
| Conservative | 2000 - 2002 |
| No overall control | 2002 - 2003 |
| Conservative | 2003–present |
Council elections
- 1973 Stratford-on-Avon District Council election
- 1976 Stratford-on-Avon District Council election
- 1979 Stratford-on-Avon District Council election (New ward boundaries)[4]
- 1980 Stratford-on-Avon District Council election
- 1982 Stratford-on-Avon District Council election
- 1983 Stratford-on-Avon District Council election
- 1984 Stratford-on-Avon District Council election
- 1986 Stratford-on-Avon District Council election
- 1987 Stratford-on-Avon District Council election
- 1988 Stratford-on-Avon District Council election
- 1990 Stratford-on-Avon District Council election
- 1991 Stratford-on-Avon District Council election
- 1992 Stratford-on-Avon District Council election
- 1994 Stratford-on-Avon District Council election (District boundary changes took place but the number of seats remained the same)[5][6]
- 1995 Stratford-on-Avon District Council election
- 1996 Stratford-on-Avon District Council election
- 1998 Stratford-on-Avon District Council election
- 1999 Stratford-on-Avon District Council election
- 2000 Stratford-on-Avon District Council election
- 2002 Stratford-on-Avon District Council election (New ward boundaries reduced the number of seats by 2)[7][8]
- 2003 Stratford-on-Avon District Council election
- 2004 Stratford-on-Avon District Council election
- 2006 Stratford-on-Avon District Council election
- 2007 Stratford-on-Avon District Council election
- 2008 Stratford-on-Avon District Council election (Some new ward boundaries)[9]
- 2010 Stratford-on-Avon District Council election
- 2011 Stratford-on-Avon District Council election
- 2012 Stratford-on-Avon District Council election
- 2014 Stratford-on-Avon District Council election
- 2015 Stratford-on-Avon District Council election (New ward boundaries)[10]
District result maps
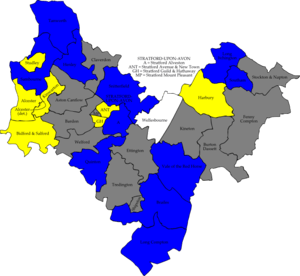
 2006 results map
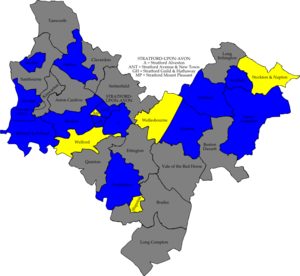
 2007 results map
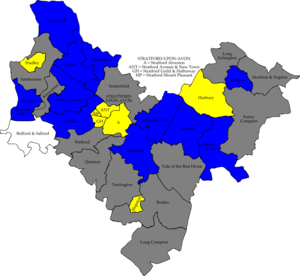
 2008 results map
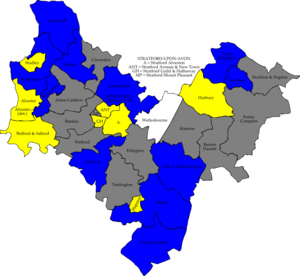
 2010 results map
By-election results
1993-1997
| Party | Candidate | Votes | % | ± | |
|---|---|---|---|---|---|
| Conservative | 277 | 67.7 | |||
| Liberal Democrats | 132 | 32.4 | |||
| Majority | 145 | 35.3 | |||
| Turnout | 409 | 32.0 | |||
| Conservative hold | Swing | ||||
| Party | Candidate | Votes | % | ± | |
|---|---|---|---|---|---|
| Independent | 266 | 56.5 | |||
| Conservative | 167 | 35.4 | |||
| Labour | 38 | 8.0 | |||
| Majority | 99 | 21.1 | |||
| Turnout | 471 | 35.3 | |||
| Independent hold | Swing | ||||
1997-2001
| Party | Candidate | Votes | % | ± | |
|---|---|---|---|---|---|
| Conservative | 441 | 58.9 | +7.3 | ||
| Liberal Democrats | 308 | 41.1 | -7.3 | ||
| Majority | 133 | 17.8 | |||
| Turnout | 749 | 37.0 | |||
| Conservative hold | Swing | ||||
| Party | Candidate | Votes | % | ± | |
|---|---|---|---|---|---|
| Liberal Democrats | 306 | 67.3 | |||
| Independent | 149 | 32.7 | |||
| Majority | 157 | 34.6 | |||
| Turnout | 455 | ||||
| Liberal Democrats hold | Swing | ||||
2001-2005
| Party | Candidate | Votes | % | ± | |
|---|---|---|---|---|---|
| Liberal Democrats | Darren Pemberton | 449 | 48.4 | +48.4 | |
| Conservative | Graham Getgood | 405 | 43.7 | -7.4 | |
| Labour | Michael Gerard | 73 | 7.9 | -3.7 | |
| Majority | 44 | 4.7 | |||
| Turnout | 927 | ||||
| Liberal Democrats gain from Independent | Swing | ||||
| Party | Candidate | Votes | % | ± | |
|---|---|---|---|---|---|
| Conservative | Richard Adams | 313 | 55.5 | -10.8 | |
| Liberal Democrats | Virginia Mason | 228 | 40.4 | +6.7 | |
| Labour | Jacqueline Abbott | 23 | 4.1 | +4.1 | |
| Majority | 85 | 15.1 | |||
| Turnout | 564 | 40.2 | |||
| Conservative hold | Swing | ||||
| Party | Candidate | Votes | % | ± | |
|---|---|---|---|---|---|
| Conservative | Gillian Roche | 469 | 48.8 | -23.9 | |
| Liberal Democrats | 391 | 40.6 | +13.3 | ||
| Independent | 73 | 7.6 | +7.6 | ||
| Green | 29 | 3.0 | +3.0 | ||
| Majority | 78 | 8.2 | |||
| Turnout | 962 | 53.1 | |||
| Conservative hold | Swing | ||||
| Party | Candidate | Votes | % | ± | |
|---|---|---|---|---|---|
| Liberal Democrats | 727 | 48.6 | +5.5 | ||
| Conservative | 489 | 32.7 | -24.2 | ||
| Independent | 281 | 18.7 | +18.7 | ||
| Majority | 238 | 15.9 | |||
| Turnout | 1,497 | 35.3 | |||
| Liberal Democrats gain from Conservative | Swing | ||||
2005-2009
| Party | Candidate | Votes | % | ± | |
|---|---|---|---|---|---|
| Conservative | Stephen Gray | 706 | 57.4 | ||
| Liberal Democrats | Virginia Mason | 523 | 42.6 | ||
| Majority | 283 | 14.8 | |||
| Turnout | 1,229 | 73.2 | |||
| Conservative hold | Swing | ||||
| Party | Candidate | Votes | % | ± | |
|---|---|---|---|---|---|
| Conservative | Laura Main | 897 | 47.2 | ||
| Liberal Democrats | Priscilla Cook | 804 | 42.4 | ||
| Labour | John Ritchie | 197 | 10.4 | ||
| Majority | 93 | 4.8 | |||
| Turnout | 1,898 | 35.9 | |||
| Conservative hold | Swing | ||||
| Party | Candidate | Votes | % | ± | |
|---|---|---|---|---|---|
| Conservative | Susan Adams | 798 | 53.5 | +22.4 | |
| Liberal Democrats | Karyl Rees | 638 | 42.8 | -13.9 | |
| Labour | Matthew Stephens | 54 | 3.6 | -2.0 | |
| Majority | 160 | 10.7 | |||
| Turnout | 1,490 | 31.8 | |||
| Conservative gain from Liberal Democrats | Swing | ||||
| Party | Candidate | Votes | % | ± | |
|---|---|---|---|---|---|
| Conservative | Susan Wixey | 712 | 54.4 | +13.3 | |
| Liberal Democrats | Sandra Knapton | 598 | 45.6 | -13.3 | |
| Majority | 114 | 8.8 | |||
| Turnout | 1,310 | 39.4 | |||
| Conservative gain from Liberal Democrats | Swing | ||||
2009-2013
| Party | Candidate | Votes | % | ± | |
|---|---|---|---|---|---|
| Liberal Democrats | Anthony Cronin | 888 | 47.0 | -2.1 | |
| Conservative | Lynda Organ | 834 | 44.1 | +1.8 | |
| Labour | David Talbot | 111 | 5.9 | +5.9 | |
| Green | Hugh Chatwin | 58 | 3.1 | +3.1 | |
| Majority | 54 | 2.9 | |||
| Turnout | 1,891 | 31.2 | |||
| Liberal Democrats gain from Conservative | Swing | ||||
2013-present
| Party | Candidate | Votes | % | ± | |
|---|---|---|---|---|---|
| Liberal Democrats | Hazel Wright | 632 | 55.3 | +24.1 | |
| Conservative | Paul Beaman | 233 | 20.4 | -12.2 | |
| Labour | Karen Somner-Brown | 156 | 13.7 | +4.5 | |
| Independent | Nick Moon | 66 | 5.8 | N/A | |
| UKIP | Nigel Rogers | 55 | 4.8 | -5.5 | |
| Majority | 376 | 34.9 | |||
| Turnout | 39.5 | ||||
| Liberal Democrats gain from Conservative | Swing | ||||
The by-election was caused by the resignation of Councillor Nick Moon, who was elected as a Conservative. However, Moon changed his mind and contested the election as an Independent, receiving 5.8% of the vote[19]
gollark: 🥖 ⚡
gollark: *tick*
gollark: Or just access some random bit of memory or crash.
gollark: Out of bounds indexing could cause demons to infest your nose, apparently.
gollark: Undefined behavior.
References
- "Structure". Stratford-on-Avon District Council. Retrieved 2010-03-11.
- "Stratford-On-Avon". BBC News Online. 2008-04-19. Retrieved 2009-09-17.
- "Tories slump after leadership row". guardian.co.uk. London. 2002-11-08. Retrieved 2009-09-17.
- The District of Stratford-on-Avon (Electoral Arrangements) Order 1977
- legislation.gov.uk - The Hereford and Worcester and Warwickshire (County Boundaries) Order 1993. Retrieved on 5 November 2015.
- legislation.gov.uk - The Hereford and Worcester, Warwickshire and West Midlands (County and Metropolitan Borough Boundaries) Order 1993. Retrieved on 5 November 2015.
- "Stratford-on-Avon". BBC News Online. Retrieved 2009-09-17.
- legislation.gov.uk - The District of Stratford-on-Avon (Electoral Changes) Order 2000. Retrieved on 4 October 2015.
- legislation.gov.uk - The Stratford-on-Avon (Parish Electoral Arrangements and Electoral Changes) Order 2008. Retrieved on 3 November 2015.
- legislation.gov.uk - The Stratford-on-Avon (Electoral Changes) Order 2014. Retrieved on 3 November 2015.
- "Council election win for LibDem party". Coventry Evening Telegraph. 2001-09-18. p. 5.
- "Tories make shock gain from SNP". guardian.co.uk. London. 2002-09-20. Retrieved 2009-09-17.
- "Election Details and Results". Stratford-on-Avon District Council. Archived from the original on 2010-02-26. Retrieved 2009-09-17.
- "Wellesbourne Elections". Stratford-on-Avon District Council. Archived from the original on 2009-11-03. Retrieved 2009-09-17.
- "August 2006 Alcester by-election". Stratford-on-Avon District Council. Archived from the original on 2009-11-03. Retrieved 2009-09-17.
- "November 2006 - Kineton by-election". Stratford-on-Avon District Council. Archived from the original on 2009-11-05. Retrieved 2009-09-17.
- "Lib Dems win both seats in Alveston by-election". Stratford Herald. 2009-11-26. Archived from the original on 2011-07-16. Retrieved 2009-11-27.
- http://redditchstandard.co.uk/news/lib-dem-hazel-wright-wins-studley-sambourne-electiom/
- http://www.herefordtimes.com/news/regional/worcestershire/14295660.Studley_with_Sambourne_District_by_election_takes_place_this_Thursday/?ref=rss
External links
This article is issued from Wikipedia. The text is licensed under Creative Commons - Attribution - Sharealike. Additional terms may apply for the media files.