Signal separation
Source separation, blind signal separation (BSS) or blind source separation, is the separation of a set of source signals from a set of mixed signals, without the aid of information (or with very little information) about the source signals or the mixing process. It is most commonly applied in digital signal processing and involves the analysis of mixtures of signals; the objective is to recover the original component signals from a mixture signal. The classical example of a source separation problem is the cocktail party problem, where a number of people are talking simultaneously in a room (for example, at a cocktail party), and a listener is trying to follow one of the discussions. The human brain can handle this sort of auditory source separation problem, but it is a difficult problem in digital signal processing.
This problem is in general highly underdetermined, but useful solutions can be derived under a surprising variety of conditions. Much of the early literature in this field focuses on the separation of temporal signals such as audio. However, blind signal separation is now routinely performed on multidimensional data, such as images and tensors,[1] which may involve no time dimension whatsoever.
Several approaches have been proposed for the solution of this problem but development is currently still very much in progress. Some of the more successful approaches are principal components analysis and independent component analysis, which work well when there are no delays or echoes present; that is, the problem is simplified a great deal. The field of computational auditory scene analysis attempts to achieve auditory source separation using an approach that is based on human hearing.
The human brain must also solve this problem in real time. In human perception this ability is commonly referred to as auditory scene analysis or the cocktail party effect.
Applications

Cocktail party problem
At a cocktail party, there is a group of people talking at the same time. You have multiple microphones picking up mixed signals, but you want to isolate the speech of a single person. BSS can be used to separate the individual sources by using mixed signals. In the presence of noise, dedicated optimization criteria need to be used[2]
Image processing

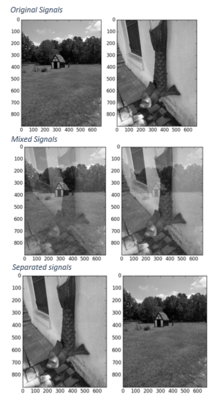
Figure 2 shows the basic concept of BSS. The individual source signals are shown as well as the mixed signals which are received signals. BSS is used to separate the mixed signals with only knowing mixed signals and nothing about original signal or how they were mixed. The separated signals are only approximations of the source signals. The separated images, were separated using Python and the Shogun toolbox using Joint Approximation Diagonalization of Eigen-matrices (JADE) algorithm which is based off independent component analysis, ICA.[3] This toolbox method can be used with multi-dimensions but for an easy visual aspect images(2-D) were used.
Medical imaging
One of the practical applications being researched in this area is medical imaging of the brain with magnetoencephalography (MEG). This kind of imaging involves careful measurements of magnetic fields outside the head which yield an accurate 3D-picture of the interior of the head. However, external sources of electromagnetic fields, such as a wristwatch on the subject's arm, will significantly degrade the accuracy of the measurement. Applying source separation techniques on the measured signals can help remove undesired artifacts from the signal.
EEG
In electroencephalogram (EEG) and magnetoencephalography (MEG), the interference from muscle activity masks the desired signal from brain activity. BSS, however, can be used to separate the two so an accurate representation of brain activity may be achieved.[4][5]
Music
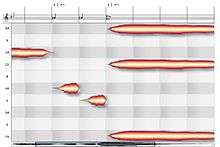
Another application is the separation of musical signals. For a stereo mix of relatively simple signals it is now possible to make a fairly accurate separation, although some artifacts remain.
Others
Other applications:[4]
- Communications
- Stock Prediction
- Seismic Monitoring
- Text Document Analysis
Mathematical representation

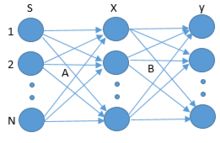
The set of individual source signals, , is 'mixed' using a matrix, , to produce a set of 'mixed' signals, , as follows. Usually, is equal to . If , then the system of equations is overdetermined and thus can be unmixed using a conventional linear method. If , the system is underdetermined and a non-linear method must be employed to recover the unmixed signals. The signals themselves can be multidimensional.
The above equation is effectively 'inverted' as follows. Blind source separation separates the set of mixed signals, , through the determination of an 'unmixing' matrix, , to 'recover' an approximation of the original signals, .[6][7][4]
Approaches
Since the chief difficulty of the problem is its underdetermination, methods for blind source separation generally seek to narrow the set of possible solutions in a way that is unlikely to exclude the desired solution. In one approach, exemplified by principal and independent component analysis, one seeks source signals that are minimally correlated or maximally independent in a probabilistic or information-theoretic sense. A second approach, exemplified by nonnegative matrix factorization, is to impose structural constraints on the source signals. These structural constraints may be derived from a generative model of the signal, but are more commonly heuristics justified by good empirical performance. A common theme in the second approach is to impose some kind of low-complexity constraint on the signal, such as sparsity in some basis for the signal space. This approach can be particularly effective if one requires not the whole signal, but merely its most salient features.
Methods
There are different methods of blind signal separation:
- Principal components analysis
- Singular value decomposition
- Independent component analysis[8]
- Dependent component analysis
- Non-negative matrix factorization
- Low-complexity coding and decoding
- Stationary subspace analysis
- Common spatial pattern
See also
- Adaptive filtering
- Celemony Software#DNA Direct Note Access
- Colin Cherry
- Deconvolution
- Factorial codes
- Infomax principle
- Segmentation (image processing)
- Speech segmentation
References
- P. Comon and C. Jutten (editors). “Handbook of Blind Source Separation, Independent Component Analysis and Applications” Academic Press, ISBN 978-2-296-12827-9
- P. Comon, Contrasts, Independent Component Analysis, and Blind Deconvolution, "Int. Journal Adapt. Control Sig. Proc.", Wiley, Apr. 2004. HAL link
- Kevin Hughes “Blind Source Separation on Images with Shogun” http://shogun-toolbox.org/static/notebook/current/bss_image.html
- Aapo Hyvarinen, Juha Karhunen, and Erkki Oja. “Independent Component Analysis” https://www.cs.helsinki.fi/u/ahyvarin/papers/bookfinal_ICA.pdf pp. 147–148, pp. 410–411, pp. 441–442, p. 448
- Congedo, Marco; Gouy-Pailler, Cedric; Jutten, Christian (December 2008). "On the blind source separation of human electroencephalogram by approximate joint diagonalization of second order statistics". Clinical Neurophysiology. 119 (12): 2677–2686. arXiv:0812.0494. doi:10.1016/j.clinph.2008.09.007. PMID 18993114.
- Jean-Francois Cardoso “Blind Signal Separation: statistical Principles” http://citeseerx.ist.psu.edu/viewdoc/download?doi=10.1.1.462.9738&rep=rep1&type=pdf
- Rui Li, Hongwei Li, and Fasong Wang. “Dependent Component Analysis: Concepts and Main Algorithms” http://www.jcomputers.us/vol5/jcp0504-13.pdf
- Shlens, Jonathon. "A tutorial on independent component analysis." arXiv:1404.2986
S. An, Y. Hua, J. Manton and Z. Fang, "Group decorrelation enhanced subspace method for identifying FIR MIMO channels driven by unknown uncorrelated colored sources," IEEE Transactions on Signal Processing, Vol. 53, No. 12, pp. 4429-4441, Dec 2005.
Y. Hua, S. An and Y. Xiang, "Blind identification of FIR MIMO channels by decorrelating subchannels," IEEE Transactions on Signal Processing, pp. 1143-1155, No. 5, Vol. 51, May 2003.
K. Abed-Meraim, Y. Xiang, J. Manton and Y. Hua, "Blind source separation using second-order cyclostationary statistics," IEEE Trans on Signal Processing, pp. 694-701, No.3, Vol. 49, April 2001.
External links
| Wikimedia Commons has media related to Source separation. |
| Wikimedia Commons has media related to Blind signal separation. |