Results breakdown of the 1983 Spanish local elections (Community of Madrid)
This is the results breakdown of the local elections held in the Community of Madrid on 8 May 1983. The following tables show detailed results in the autonomous community's most populous municipalities, sorted alphabetically.[1][2]
Overall
| Parties and coalitions | Popular vote | Councillors | ||||
|---|---|---|---|---|---|---|
| Votes | % | ±pp | Total | +/− | ||
| Spanish Socialist Workers' Party (PSOE) | 1,176,115 | 50.02 | +11.23 | 652 | +233 | |
| People's Coalition (AP–PDP–UL)1 | 782,926 | 33.30 | +32.68 | 557 | +511 | |
| Communist Party of Spain (PCE) | 210,971 | 8.97 | –7.81 | 141 | –76 | |
| Democratic and Social Centre (CDS) | 66,444 | 2.83 | New | 51 | +51 | |
| Liberal Democratic Party (PDL) | 45,349 | 1.93 | New | 10 | +10 | |
| Workers' Socialist Party (PST) | 7,757 | 0.33 | New | 0 | ±0 | |
| Spanish Communist Workers' Party (PCOE) | 3,284 | 0.14 | –0.12 | 0 | ±0 | |
| Natural Culture (CN) | 2,281 | 0.10 | New | 0 | ±0 | |
| Communist Candidacy (CC) | 2,280 | 0.10 | New | 0 | ±0 | |
| Revolutionary Communist League (LCR) | 2,161 | 0.09 | –0.02 | 0 | ±0 | |
| Independents (Fuenlabrada) (INDEP) | 1,867 | 0.08 | +0.05 | 1 | ±0 | |
| Spanish Phalanx of the CNSO (FE–JONS) | 1,761 | 0.07 | –1.16 | 3 | +3 | |
| Left Movement of Alcalá (MIA) | 1,497 | 0.06 | New | 0 | ±0 | |
| Independent Group of Cercedilla (GIC) | 1,441 | 0.06 | New | 7 | +7 | |
| Popular Struggle Coalition (CLP) | 1,186 | 0.05 | New | 0 | ±0 | |
| Socialist Action Party (PASOC)2 | 427 | 0.02 | –0.24 | 0 | ±0 | |
| Others | 36,027 | 1.53 | — | 343 | –684 | |
| Blank ballots | 7,402 | 0.31 | +0.31 | |||
| Total | 2,351,176 | 1,765 | +55 | |||
| Valid votes | 2,351,176 | 99.30 | –0.68 | |||
| Invalid votes | 16,517 | 0.70 | +0.68 | |||
| Votes cast / turnout | 2,367,693 | 68.65 | +3.07 | |||
| Abstentions | 1,081,313 | 31.35 | –3.07 | |||
| Registered voters | 3,449,006 | |||||
| Sources[1][3] | ||||||
City control
The following table lists party control in the most populous municipalities, including provincial capitals (shown in bold).[1] Gains for a party are displayed with the cell's background shaded in that party's colour.
| Municipality | Population | Previous control | New control | ||
|---|---|---|---|---|---|
| Alcalá de Henares | 137,169 | Spanish Socialist Workers' Party (PSOE) | Spanish Socialist Workers' Party (PSOE) | ||
| Alcobendas | 63,731 | Spanish Socialist Workers' Party (PSOE) | Spanish Socialist Workers' Party (PSOE) | ||
| Alcorcón | 140,957 | Spanish Socialist Workers' Party (PSOE) | Spanish Socialist Workers' Party (PSOE) | ||
| Coslada | 53,730 | Spanish Socialist Workers' Party (PSOE) | Communist Party of Spain (PCE) | ||
| Fuenlabrada | 78,096 | Spanish Socialist Workers' Party (PSOE) | Spanish Socialist Workers' Party (PSOE) | ||
| Getafe | 126,558 | Spanish Socialist Workers' Party (PSOE) | Spanish Socialist Workers' Party (PSOE) | ||
| Leganés | 163,910 | Spanish Socialist Workers' Party (PSOE) | Spanish Socialist Workers' Party (PSOE) | ||
| Madrid | 3,158,818 | Spanish Socialist Workers' Party (PSOE) | Spanish Socialist Workers' Party (PSOE) | ||
| Móstoles | 150,259 | Spanish Socialist Workers' Party (PSOE) | Spanish Socialist Workers' Party (PSOE) | ||
| Parla | 56,318 | Spanish Socialist Workers' Party (PSOE) | Spanish Socialist Workers' Party (PSOE) | ||
| Torrejón de Ardoz | 75,599 | Spanish Socialist Workers' Party (PSOE) | Spanish Socialist Workers' Party (PSOE) | ||
Municipalities
Alcalá de Henares
- Population: 137,169
 | ||||||
| Parties and coalitions | Popular vote | Seats | ||||
|---|---|---|---|---|---|---|
| Votes | % | ±pp | Total | +/− | ||
| Spanish Socialist Workers' Party (PSOE) | 31,849 | 57.35 | +17.82 | 17 | +5 | |
| People's Coalition (AP–PDP–UL)1 | 11,596 | 20.88 | +18.10 | 6 | +6 | |
| Communist Party of Spain (PCE) | 7,752 | 13.96 | –7.72 | 4 | –2 | |
| Democratic and Social Centre (CDS) | 1,990 | 3.58 | New | 0 | ±0 | |
| Left Movement of Alcalá (MIA) | 1,497 | 2.70 | New | 0 | ±0 | |
| Independent (INDEP) | 385 | 0.69 | New | 0 | ±0 | |
| Liberal Democratic Party (PDL) | 371 | 0.67 | New | 0 | ±0 | |
| Popular Struggle Coalition (CLP) | 91 | 0.16 | New | 0 | ±0 | |
| Union of the Democratic Centre (UCD) | n/a | n/a | –23.45 | 0 | –7 | |
| Workers' Revolutionary Organization (ORT) | n/a | n/a | –9.45 | 0 | –2 | |
| Blank ballots | 0 | 0.00 | ±0.00 | |||
| Total | 55,531 | 27 | ±0 | |||
| Valid votes | 55,531 | 100.00 | ±0.00 | |||
| Invalid votes | 0 | 0.00 | ±0.00 | |||
| Votes cast / turnout | 55,531 | 63.16 | +5.22 | |||
| Abstentions | 32,391 | 36.84 | –5.22 | |||
| Registered voters | 87,922 | |||||
| Sources[1][4] | ||||||
Alcobendas
- Population: 63,731
 | ||||||
| Parties and coalitions | Popular vote | Seats | ||||
|---|---|---|---|---|---|---|
| Votes | % | ±pp | Total | +/− | ||
| Spanish Socialist Workers' Party (PSOE) | 15,174 | 59.04 | +11.13 | 16 | +3 | |
| People's Coalition (AP–PDP–UL) | 7,303 | 28.42 | New | 7 | +7 | |
| Communist Party of Spain (PCE) | 2,428 | 9.45 | –12.56 | 2 | –4 | |
| Democratic and Social Centre (CDS) | 795 | 3.09 | New | 0 | ±0 | |
| Union of the Democratic Centre (UCD) | n/a | n/a | –20.69 | 0 | –5 | |
| Independents (INDEP) | n/a | n/a | –6.08 | 0 | –1 | |
| Blank ballots | 0 | 0.00 | ±0.00 | |||
| Total | 25,700 | 25 | ±0 | |||
| Valid votes | 25,700 | 100.00 | ±0.00 | |||
| Invalid votes | 0 | 0.00 | ±0.00 | |||
| Votes cast / turnout | 25,700 | 66.47 | +5.84 | |||
| Abstentions | 12,964 | 33.53 | –5.84 | |||
| Registered voters | 38,664 | |||||
| Sources[1][5] | ||||||
Alcorcón
- Population: 140,957
 | ||||||
| Parties and coalitions | Popular vote | Seats | ||||
|---|---|---|---|---|---|---|
| Votes | % | ±pp | Total | +/− | ||
| Spanish Socialist Workers' Party (PSOE) | 39,540 | 66.54 | +19.49 | 19 | +5 | |
| People's Coalition (AP–PDP–UL)1 | 13,052 | 21.97 | +20.08 | 6 | +6 | |
| Communist Party of Spain (PCE) | 4,782 | 8.05 | –14.58 | 2 | –5 | |
| Democratic and Social Centre (CDS) | 1,601 | 2.69 | New | 0 | ±0 | |
| Workers' Socialist Party (PST) | 444 | 0.75 | New | 0 | ±0 | |
| Union of the Democratic Centre (UCD) | n/a | n/a | –20.48 | 0 | –6 | |
| Blank ballots | 0 | 0.00 | ±0.00 | |||
| Total | 59,419 | 27 | ±0 | |||
| Valid votes | 59,419 | 100.00 | ±0.00 | |||
| Invalid votes | 0 | 0.00 | ±0.00 | |||
| Votes cast / turnout | 59,419 | 67.18 | +8.71 | |||
| Abstentions | 29,031 | 32.82 | –8.71 | |||
| Registered voters | 88,450 | |||||
| Sources[1][6] | ||||||
Coslada
- Population: 53,730
 | ||||||
| Parties and coalitions | Popular vote | Seats | ||||
|---|---|---|---|---|---|---|
| Votes | % | ±pp | Total | +/− | ||
| Communist Party of Spain (PCE) | 12,930 | 53.98 | +9.64 | 14 | +5 | |
| Spanish Socialist Workers' Party (PSOE) | 8,120 | 33.90 | –1.34 | 8 | ±0 | |
| People's Coalition (AP–PDP–UL) | 2,905 | 12.13 | New | 3 | +3 | |
| Union of the Democratic Centre (UCD) | n/a | n/a | –14.21 | 0 | –3 | |
| Workers' Revolutionary Organization (ORT) | n/a | n/a | –6.20 | 0 | –1 | |
| Blank ballots | 0 | 0.00 | ±0.00 | |||
| Total | 23,955 | 25 | +4 | |||
| Valid votes | 23,955 | 100.00 | ±0.00 | |||
| Invalid votes | 0 | 0.00 | ±0.00 | |||
| Votes cast / turnout | 23,955 | 70.46 | +2.61 | |||
| Abstentions | 10,044 | 29.54 | –2.61 | |||
| Registered voters | 33,999 | |||||
| Sources[1][7] | ||||||
Fuenlabrada
- Population: 78,096
 | ||||||
| Parties and coalitions | Popular vote | Seats | ||||
|---|---|---|---|---|---|---|
| Votes | % | ±pp | Total | +/− | ||
| Spanish Socialist Workers' Party (PSOE) | 20,296 | 65.45 | +26.54 | 18 | +9 | |
| People's Coalition (AP–PDP–UL) | 4,206 | 13.56 | New | 3 | +3 | |
| Communist Party of Spain (PCE) | 3,321 | 10.71 | –6.74 | 3 | –1 | |
| Independents (INDEP) | 1,867 | 6.02 | –0.13 | 1 | ±0 | |
| Democratic and Social Centre (CDS) | 542 | 1.75 | New | 0 | ±0 | |
| Communist Candidacy (CC) | 346 | 1.12 | New | 0 | ±0 | |
| Workers' Socialist Party (PST) | 229 | 0.74 | New | 0 | ±0 | |
| Liberal Democratic Party (PDL) | 202 | 0.65 | New | 0 | ±0 | |
| Union of the Democratic Centre (UCD) | n/a | n/a | –31.14 | 0 | –7 | |
| Blank ballots | 0 | 0.00 | ±0.00 | |||
| Total | 31,009 | 25 | +4 | |||
| Valid votes | 31,009 | 100.00 | ±0.00 | |||
| Invalid votes | 0 | 0.00 | ±0.00 | |||
| Votes cast / turnout | 31,009 | 60.05 | +2.07 | |||
| Abstentions | 20,628 | 39.95 | –2.07 | |||
| Registered voters | 51,637 | |||||
| Sources[1][8] | ||||||
Getafe
- Population: 126,558
 | ||||||
| Parties and coalitions | Popular vote | Seats | ||||
|---|---|---|---|---|---|---|
| Votes | % | ±pp | Total | +/− | ||
| Spanish Socialist Workers' Party (PSOE) | 35,494 | 62.68 | +27.50 | 19 | +9 | |
| People's Coalition (AP–PDP–UL)1 | 10,463 | 18.48 | +15.60 | 5 | +5 | |
| Communist Party of Spain (PCE) | 7,191 | 12.70 | –22.22 | 3 | –7 | |
| Communist Candidacy (CC) | 1,396 | 2.47 | New | 0 | ±0 | |
| Democratic and Social Centre (CDS) | 1,249 | 2.21 | New | 0 | ±0 | |
| Workers' Socialist Party (PST) | 432 | 0.76 | New | 0 | ±0 | |
| Communist League (LC) | 271 | 0.48 | New | 0 | ±0 | |
| Independent (INDEP) | 134 | 0.24 | New | 0 | ±0 | |
| Union of the Democratic Centre (UCD) | n/a | n/a | –17.97 | 0 | –5 | |
| Workers' Revolutionary Organization (ORT) | n/a | n/a | –7.81 | 0 | –2 | |
| Blank ballots | 0 | 0.00 | ±0.00 | |||
| Total | 56,630 | 27 | ±0 | |||
| Valid votes | 56,630 | 100.00 | ±0.00 | |||
| Invalid votes | 0 | 0.00 | ±0.00 | |||
| Votes cast / turnout | 56,630 | 70.16 | +8.20 | |||
| Abstentions | 24,089 | 29.84 | –8.20 | |||
| Registered voters | 80,719 | |||||
| Sources[1][9] | ||||||
Leganés
- Population: 163,910
 | ||||||
| Parties and coalitions | Popular vote | Seats | ||||
|---|---|---|---|---|---|---|
| Votes | % | ±pp | Total | +/− | ||
| Spanish Socialist Workers' Party (PSOE) | 48,694 | 69.87 | +20.46 | 20 | +6 | |
| People's Coalition (AP–PDP–UL)1 | 9,442 | 13.55 | +12.40 | 4 | +4 | |
| Communist Party of Spain (PCE) | 9,221 | 13.23 | –15.15 | 3 | –5 | |
| Democratic and Social Centre (CDS) | 1,676 | 2.40 | New | 0 | ±0 | |
| Workers' Socialist Party (PST) | 560 | 0.80 | New | 0 | ±0 | |
| Popular Struggle Coalition (CLP) | 101 | 0.14 | New | 0 | ±0 | |
| Union of the Democratic Centre (UCD) | n/a | n/a | –15.25 | 0 | –4 | |
| Workers' Revolutionary Organization (ORT) | n/a | n/a | –5.39 | 0 | –1 | |
| Blank ballots | 0 | 0.00 | ±0.00 | |||
| Total | 69,694 | 27 | ±0 | |||
| Valid votes | 69,694 | 100.00 | ±0.00 | |||
| Invalid votes | 0 | 0.00 | ±0.00 | |||
| Votes cast / turnout | 69,694 | 68.11 | +5.78 | |||
| Abstentions | 32,632 | 31.89 | –5.78 | |||
| Registered voters | 102,326 | |||||
| Sources[1][10] | ||||||
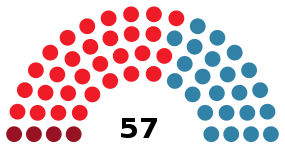
Madrid
- Population: 3,158,818
 | ||||||
| Parties and coalitions | Popular vote | Seats | ||||
|---|---|---|---|---|---|---|
| Votes | % | ±pp | Total | +/− | ||
| Spanish Socialist Workers' Party (PSOE) | 808,350 | 48.44 | +8.95 | 30 | +5 | |
| People's Coalition (AP–PDP–UL) | 631,183 | 37.82 | New | 23 | +23 | |
| Communist Party of Spain (PCE) | 113,112 | 6.78 | –7.91 | 4 | –5 | |
| Democratic and Social Centre (CDS) | 50,824 | 3.05 | New | 0 | ±0 | |
| Liberal Democratic Party (PDL) | 44,159 | 2.65 | New | 0 | ±0 | |
| Workers' Socialist Party (PST) | 5,721 | 0.34 | New | 0 | ±0 | |
| Spanish Communist Workers' Party (PCOE) | 3,284 | 0.20 | –0.13 | 0 | ±0 | |
| Natural Culture (CN) | 2,281 | 0.14 | New | 0 | ±0 | |
| Revolutionary Communist League (LCR) | 1,543 | 0.09 | –0.02 | 0 | ±0 | |
| Popular Struggle Coalition (CLP) | 859 | 0.05 | New | 0 | ±0 | |
| Union of the Democratic Centre (UCD) | n/a | n/a | –40.29 | 0 | –25 | |
| Blank ballots | 7,402 | 0.44 | +0.44 | |||
| Total | 1,668,718 | 57 | –2 | |||
| Valid votes | 1,668,718 | 99.03 | –0.97 | |||
| Invalid votes | 16,397 | 0.97 | +0.97 | |||
| Votes cast / turnout | 1,685,115 | 70.78 | +4.80 | |||
| Abstentions | 695,731 | 29.22 | –4.80 | |||
| Registered voters | 2,380,846 | |||||
| Sources[1][11][12][13] | ||||||
Móstoles
- Population: 150,259
 | ||||||
| Parties and coalitions | Popular vote | Seats | ||||
|---|---|---|---|---|---|---|
| Votes | % | ±pp | Total | +/− | ||
| Spanish Socialist Workers' Party (PSOE) | 42,599 | 69.27 | +27.75 | 20 | +7 | |
| People's Coalition (AP–PDP–UL)1 | 10,493 | 17.06 | +14.25 | 5 | +5 | |
| Communist Party of Spain (PCE) | 6,125 | 9.96 | –20.63 | 2 | –8 | |
| Democratic and Social Centre (CDS) | 1,339 | 2.18 | New | 0 | ±0 | |
| Socialist Action Party (PASOC) | 427 | 0.69 | New | 0 | ±0 | |
| Communist Candidacy (CC) | 332 | 0.54 | New | 0 | ±0 | |
| Revolutionary Communist League (LCR) | 122 | 0.20 | –0.08 | 0 | ±0 | |
| Communist Movement (MC) | 60 | 0.10 | –0.32 | 0 | ±0 | |
| Union of the Democratic Centre (UCD) | n/a | n/a | –13.53 | 0 | –4 | |
| Blank ballots | 0 | 0.00 | ±0.00 | |||
| Total | 61,497 | 27 | ±0 | |||
| Valid votes | 61,497 | 100.00 | ±0.00 | |||
| Invalid votes | 0 | 0.00 | ±0.00 | |||
| Votes cast / turnout | 61,497 | 63.25 | +9.05 | |||
| Abstentions | 35,728 | 36.75 | –9.05 | |||
| Registered voters | 97,225 | |||||
| Sources[1][14] | ||||||
Parla
- Population: 56,318
 | ||||||
| Parties and coalitions | Popular vote | Seats | ||||
|---|---|---|---|---|---|---|
| Votes | % | ±pp | Total | +/− | ||
| Spanish Socialist Workers' Party (PSOE) | 18,201 | 77.01 | +37.44 | 20 | +11 | |
| Communist Party of Spain (PCE) | 2,675 | 11.32 | –25.26 | 3 | –5 | |
| People's Coalition (AP–PDP–UL)1 | 2,663 | 11.27 | +1.79 | 2 | ±0 | |
| Popular Struggle Coalition (CLP) | 96 | 0.41 | New | 0 | ±0 | |
| Union of the Democratic Centre (UCD) | n/a | n/a | –7.33 | 0 | –1 | |
| Party of Labour of Spain (PTE) | n/a | n/a | –5.26 | 0 | –1 | |
| Blank ballots | 0 | 0.00 | ±0.00 | |||
| Total | 23,635 | 25 | +4 | |||
| Valid votes | 23,635 | 100.00 | ±0.00 | |||
| Invalid votes | 0 | 0.00 | ±0.00 | |||
| Votes cast / turnout | 23,635 | 69.51 | +5.52 | |||
| Abstentions | 10,368 | 30.49 | –5.52 | |||
| Registered voters | 34,003 | |||||
| Sources[1][15] | ||||||
Torrejón de Ardoz
- Population: 75,599
 | ||||||
| Parties and coalitions | Popular vote | Seats | ||||
|---|---|---|---|---|---|---|
| Votes | % | ±pp | Total | +/− | ||
| Spanish Socialist Workers' Party (PSOE) | 19,436 | 64.64 | +20.43 | 17 | +5 | |
| People's Coalition (AP–PDP–UL) | 5,433 | 18.07 | New | 5 | +5 | |
| Communist Party of Spain (PCE) | 4,353 | 14.48 | –14.15 | 3 | –4 | |
| Democratic and Social Centre (CDS) | 846 | 2.81 | New | 0 | ±0 | |
| Union of the Democratic Centre (UCD) | n/a | n/a | –14.67 | 0 | –4 | |
| Independent (INDEP) | n/a | n/a | –7.75 | 0 | –2 | |
| Blank ballots | 0 | 0.00 | ±0.00 | |||
| Total | 30,068 | 25 | ±0 | |||
| Valid votes | 30,068 | 100.00 | ±0.00 | |||
| Invalid votes | 0 | 0.00 | ±0.00 | |||
| Votes cast / turnout | 30,068 | 64.60 | +5.25 | |||
| Abstentions | 16,479 | 35.40 | –5.25 | |||
| Registered voters | 46,547 | |||||
| Sources[1][16] | ||||||
gollark: You can probably distinguish 4 colors at a decent distance, and switching twice a second seems vaguely plausible, so that's 4 bits a second.
gollark: Can you generate and detect different *colors*?
gollark: Assuming you can switch the light on and off pretty fast, and the magic can respond quickly, you might actually get decent data rates out of it.
gollark: Well, in that case I guess you could do automatic Morse code (or some variant), and if you could make a bright enough light (and maybe focus it on the receiving tower with mirrors or something), that might be longer-range than having to actually see the individual semaphore arms.
gollark: Oh, right. Hmm.
See also
References
- "Municipal elections in the Community of Madrid since 1979". historiaelectoral.com (in Spanish). Electoral History. Retrieved 13 December 2018.
- "Elecciones Municipales. 8 de mayo de 1983. Madrid". elecciones.eldiario.es (in Spanish). eldiario.es. Retrieved 7 June 2019.
- "Electoral Results Consultation. Municipal. May 1983. Community of Madrid". www.infoelectoral.mir.es (in Spanish). Ministry of the Interior. Retrieved 22 December 2018.
- "Electoral Results Consultation. Municipal. May 1983. Alcalá de Henares Municipality". www.infoelectoral.mir.es (in Spanish). Ministry of the Interior. Retrieved 13 December 2018.
- "Electoral Results Consultation. Municipal. May 1983. Alcobendas Municipality". www.infoelectoral.mir.es (in Spanish). Ministry of the Interior. Retrieved 13 December 2018.
- "Electoral Results Consultation. Municipal. May 1983. Alcorcón Municipality". www.infoelectoral.mir.es (in Spanish). Ministry of the Interior. Retrieved 13 December 2018.
- "Electoral Results Consultation. Municipal. May 1983. Coslada Municipality". www.infoelectoral.mir.es (in Spanish). Ministry of the Interior. Retrieved 13 December 2018.
- "Electoral Results Consultation. Municipal. May 1983. Fuenlabrada Municipality". www.infoelectoral.mir.es (in Spanish). Ministry of the Interior. Retrieved 13 December 2018.
- "Electoral Results Consultation. Municipal. May 1983. Getafe Municipality". www.infoelectoral.mir.es (in Spanish). Ministry of the Interior. Retrieved 13 December 2018.
- "Electoral Results Consultation. Municipal. May 1983. Leganés Municipality". www.infoelectoral.mir.es (in Spanish). Ministry of the Interior. Retrieved 13 December 2018.
- "City Council of Madrid. Elections". madrid.es (in Spanish). City Council of Madrid. Retrieved 5 December 2017.
- "Electoral Results Consultation. Municipal. May 1983. Madrid Municipality". www.infoelectoral.mir.es (in Spanish). Ministry of the Interior. Retrieved 12 November 2017.
- "Municipal elections in Madrid since 1979". historiaelectoral.com (in Spanish). Electoral History. Retrieved 30 September 2017.
- "Electoral Results Consultation. Municipal. May 1983. Móstoles Municipality". www.infoelectoral.mir.es (in Spanish). Ministry of the Interior. Retrieved 13 December 2018.
- "Electoral Results Consultation. Municipal. May 1983. Parla Municipality". www.infoelectoral.mir.es (in Spanish). Ministry of the Interior. Retrieved 13 December 2018.
- "Electoral Results Consultation. Municipal. May 1983. Torrejón de Ardoz Municipality". www.infoelectoral.mir.es (in Spanish). Ministry of the Interior. Retrieved 13 December 2018.
| Regional elections | |
|---|---|
| General elections | |
| European Parliament elections | |
| Local elections | |
This article is issued from Wikipedia. The text is licensed under Creative Commons - Attribution - Sharealike. Additional terms may apply for the media files.