Raygor readability estimate
The Raygor estimate graph is a readability metric for English text. It was developed by Alton L. Raygor, who published it in 1977.
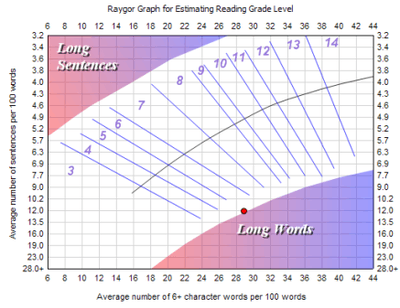
A rendition of the Raygor Graph.
The US grade level is calculated by the average number of sentences and letters per hundred words. These averages are plotted onto a specific graph where the intersection of the average number of sentences and the average number of letters/word determines the reading level of the content. Note that this graph is very similar to the Fry readability formula's graph.
This graph is primarily used in secondary education to help classify teaching materials and books into their appropriate reading groups.
The formula
- Extract a 100-word passage from the selection. If the material is long, take a subsample from the beginning, middle, and end.
- Count the number of sentences in each passage. Count a half sentence as 0.5.
- Count the number of words in each passage containing six or more letters.
- Find the point on the Raygor estimate graph.
gollark: ++magic py bot.guilds
gollark: I'll probably only add it if/when it gets stuck in a loop trying to send to nonexistent channels.
gollark: Maybe it tries, in priority order:- other channels on the same server- direct messages to the user- other channels on any servers they're in- other channels on any server whatsoever- random people in the queue for reminders
gollark: I should really have some counterapiomeasures in place if a channel/server doesn't exist when it tries to remind someone.
gollark: ++remind 1y6mo take over server
References
This article is issued from Wikipedia. The text is licensed under Creative Commons - Attribution - Sharealike. Additional terms may apply for the media files.