Römerswil
Römerswil is a municipality in the district of Hochdorf in the canton of Lucerne in Switzerland.
Römerswil | |
|---|---|
 | |
 Coat of arms | |
Location of Römerswil 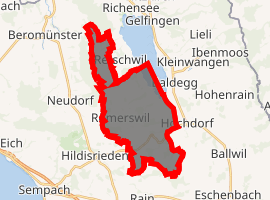
| |
 Römerswil Römerswil | |
| Coordinates: 47°10′N 8°15′E | |
| Country | Switzerland |
| Canton | Lucerne |
| District | Hochdorf |
| Area | |
| • Total | 16.65 km2 (6.43 sq mi) |
| Elevation | 723 m (2,372 ft) |
| Population (2018-12-31)[2] | |
| • Total | 1,789 |
| • Density | 110/km2 (280/sq mi) |
| Postal code | 6027,6028 |
| SFOS number | 1039 |
| Surrounded by | Ermensee, Gelfingen, Gunzwil, Hildisrieden, Hitzkirch, Hochdorf, Hohenrain, Huwyl, Neudorf, Rain, Retschwil |
| Website | www Profile (in German), SFSO statistics |
History
Herlisberg is first mentioned in 1173 as Heigesperhc. In 1242 it was mentioned as Hergesberch.[3]
Geography
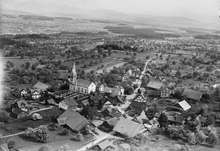
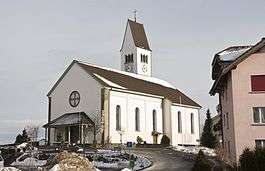
Römerswil is located in the Seetal valley. It lies 3 km (1.9 mi) to the west of the district capital of Hochdorf, 1 km (0.62 mi) from Huwyl and 2 km (1.2 mi) from Lake Baldegg.
The municipality has an area of 16.7 km2 (6.4 sq mi). Of this area, 77% is used for agricultural purposes, while 16.3% is forested. Of the rest of the land, 6.5% is settled (buildings or roads) and the remainder (0.2%) is non-productive (rivers, glaciers or mountains).[4] In the 1997 land survey, 16.22% of the total land area was forested. Of the agricultural land, 68.53% is used for farming or pastures, while 8.53% is used for orchards or vine crops. Of the settled areas, 3.3% is covered with buildings, 0.3% is industrial, 0.66% is classed as special developments, 0.12% is parks or greenbelts and 2.16% is transportation infrastructure. Of the unproductive areas, 0.06% is unproductive flowing water (rivers) and 0.12% is other unproductive land.[5]
On 1 January 2005, the formerly independent municipality of Herlisberg, lying 3.3 km (2.1 mi) to the northwest, was united with Römerswil.[6]
Demographics
Römerswil has a population (as of 31 December 2018) of 1,789.[7] As of 2007, 3.3% of the population was made up of foreign nationals. Over the last 10 years the population has grown at a rate of 5.1%. Most of the population (as of 2000) speaks German (98.3%), with Serbo-Croatian being second most common ( 0.6%) and French being third ( 0.2%).
In the 2007 election the most popular party was the CVP which received 41% of the vote. The next three most popular parties were the SVP (33%), the FDP (15%) and the Green Party (6.2%).
The age distribution in Römerswil is; 438 people or 27.8% of the population is 0–19 years old. 409 people or 25.9% are 20–39 years old, and 528 people or 33.5% are 40–64 years old. The senior population distribution is 156 people or 9.9% are 65–79 years old, 44 or 2.8% are 80–89 years old and 2 people or 0.1% of the population are 90+ years old.[5]
In Römerswil about 74.7% of the population (between age 25-64) have completed either non-mandatory upper secondary education or additional higher education (either university or a Fachhochschule).
As of 2000 there are 495 households, of which 94 households (or about 19.0%) contain only a single individual. 88 or about 17.8% are large households, with at least five members.[5] As of 2000 there were 327 inhabited buildings in the municipality, of which 215 were built only as housing, and 112 were mixed use buildings. There were 166 single family homes, 29 double family homes, and 20 multi-family homes in the municipality. Most homes were either two (143) or three (48) story structures. There were only 15 single story buildings and 9 four or more story buildings.[5]
Römerswil has an unemployment rate of 0.48%. As of 2005, there were 249 people employed in the primary economic sector and about 91 businesses involved in this sector. 152 people are employed in the secondary sector and there are 16 businesses in this sector. 88 people are employed in the tertiary sector, with 18 businesses in this sector.[4] As of 2000 53.5% of the population of the municipality were employed in some capacity. At the same time, females made up 38.8% of the workforce.
In the 2000 census the religious membership of Römerswil was; 1,220 (83.1%) were Roman Catholic, and 99 (6.7%) were Protestant, with an additional 11 (0.75%) that were of some other Christian faith. There are 13 individuals (0.89% of the population) who are Muslim. Of the rest; there was 1 (0.07%) individuals who belong to another religion, 79 (5.38%) who do not belong to any organized religion, 45 (3.07%) who did not answer the question.[5]
The historical population or Herlisberg alone is given in the following table:[3]
| year | population |
|---|---|
| 1798 | 217 |
| 1850 | 262 |
| 1900 | 192 |
| 1950 | 187 |
| 2000 | 239 |
References
- "Arealstatistik Standard - Gemeinden nach 4 Hauptbereichen". Federal Statistical Office. Retrieved 13 January 2019.
- "Ständige Wohnbevölkerung nach Staatsangehörigkeitskategorie Geschlecht und Gemeinde; Provisorische Jahresergebnisse; 2018". Federal Statistical Office. 9 April 2019. Retrieved 11 April 2019.
- Herlisberg in German, French and Italian in the online Historical Dictionary of Switzerland.
- Swiss Federal Statistical Office accessed 19-Aug-2009
- LUSTAT Lucerne Cantonal Statistics Archived 2011-11-27 at the Wayback Machine (in German) accessed 12 August 2009
- Canton of Lucerne, Office of Municipalities Archived 2011-07-06 at the Wayback Machine (in German) accessed 18 August 2009
- Swiss Federal Statistical Office - STAT-TAB, online database – Ständige und nichtständige Wohnbevölkerung nach institutionellen Gliederungen, Geburtsort und Staatsangehörigkeit (in German) accessed 23 September 2019
| Wikimedia Commons has media related to Römerswil. |
External links
- Herlisberg in German, French and Italian in the online Historical Dictionary of Switzerland.