New Mexico's 3rd congressional district
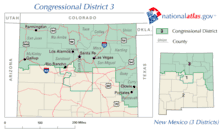
New Mexico's 3rd congressional district serves the northern half of New Mexico, including the state's Capital, Santa Fe. The district has a significant Native American presence, encompassing most of the New Mexico portion of the Navajo Nation situated in the northwest corner of the state and most of the Puebloan peoples reservations.[2] The current Representative is Democrat Ben Ray Luján.
| New Mexico's 3rd congressional district | |||
|---|---|---|---|
.tif.png) New Mexico's 3rd congressional district since January 3, 2013 | |||
| Representative |
| ||
| Distribution |
| ||
| Population (2018) | 698,251 | ||
| Median income | $49,030 | ||
| Ethnicity |
| ||
| Cook PVI | D+8[1] | ||
Voting
Election results from presidential races[3][4]
| Year | Office | Result |
|---|---|---|
| 2000 | President | Gore 52 - 43% |
| 2004 | President | Kerry 54 - 45% |
| 2008 | President | Obama 61 - 38% |
| 2012 | President | Obama 57 - 39% |
| 2016 | President | Clinton 52 - 37% |
| 2018 | Senate | Heinrich 57 - 27% |
| 2018 | Governor | Lujan Grisham 61 - 39% |
List of members representing the district
| Member | District home | Party | Years | Cong ress |
Electoral history |
|---|---|---|---|---|---|
| District created January 3, 1983 | |||||
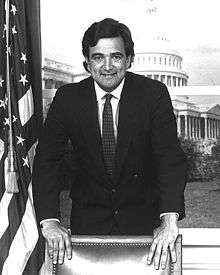 Bill Richardson |
Santa Fe | Democratic | January 3, 1983 – February 13, 1997 |
98th 99th 100th 101st 102nd 103rd 104th 105th |
Elected in 1982. Re-elected in 1984. Re-elected in 1986. Re-elected in 1988. Re-elected in 1990. Re-elected in 1992. Re-elected in 1994. Re-elected in 1996. Resigned to become U.S. Ambassador to the United Nations |
| Vacant | February 13, 1997 – May 13, 1997 |
105th | |||
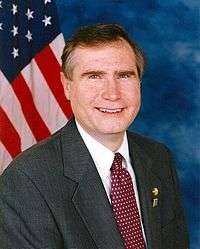 Bill Redmond |
Santa Fe | Republican | May 13, 1997 – January 3, 1999 |
Elected to finish Richardson's term Lost re-election. | |
 Tom Udall |
Santa Fe | Democratic | January 3, 1999 – January 3, 2009 |
106th 107th 108th 109th 110th |
Elected in 1998. Re-elected in 2000. Re-elected in 2002. Re-elected in 2004. Re-elected in 2006. Retired to run for U.S. senator |
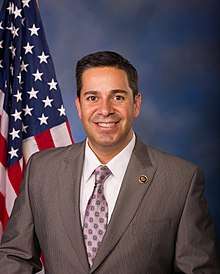 Ben Ray Luján |
Nambé | Democratic | January 3, 2009 – present |
111th 112th 113th 114th 115th 116th |
Elected in 2008. Re-elected in 2010. Re-elected in 2012. Re-elected in 2014. Re-elected in 2016. Re-elected in 2018 |
Election results
|
1982 • 1984 • 1986 • 1988 • 1990 • 1992 • 1994 • 1996 • 1997 (Special) • 1998 • 2000 • 2002 • 2004 • 2006 • 2008 • 2010 • 2012 • 2014 • 2016 • 2018 |
1982
| Party | Candidate | Votes | % | ||
|---|---|---|---|---|---|
| Democratic | Bill Richardson | 84,669 | 64.49 | ||
| Republican | Marjorie Bell Chambers | 46,466 | 35.39 | ||
| Write-in | 158 | 0.12 | |||
| Total votes | 131,293 | 100.0 | |||
| Democratic win (new seat) | |||||
1984
| Party | Candidate | Votes | % | |
|---|---|---|---|---|
| Democratic | Bill Richardson (incumbent) | 100,470 | 60.81 | |
| Republican | Louis H. Gallegos | 62,351 | 37.74 | |
| Libertarian | Shirley Machocky Jones | 2,388 | 1.45 | |
| Total votes | 165,209 | 100.0 | ||
| Democratic hold | ||||
1986
| Party | Candidate | Votes | % | |
|---|---|---|---|---|
| Democratic | Bill Richardson (incumbent) | 95,760 | 71.30 | |
| Republican | David F. Cargo | 38,552 | 28.70 | |
| Total votes | 134,312 | 100.0 | ||
| Democratic hold | ||||
1988
| Party | Candidate | Votes | % | |
|---|---|---|---|---|
| Democratic | Bill Richardson (incumbent) | 124,938 | 73.11 | |
| Republican | Cecilia M. Salazar | 45,954 | 26.89 | |
| Total votes | 170,892 | 100.0 | ||
| Democratic hold | ||||
1990
| Party | Candidate | Votes | % | |
|---|---|---|---|---|
| Democratic | Bill Richardson (incumbent) | 104,225 | 74.46 | |
| Republican | Phil T. Archuletta | 35,751 | 25.54 | |
| Total votes | 139,976 | 100.0 | ||
| Democratic hold | ||||
1992
| Party | Candidate | Votes | % | |
|---|---|---|---|---|
| Democratic | Bill Richardson (incumbent) | 122,850 | 67.42 | |
| Republican | F. Gregg Bemis, Jr. | 54,569 | 29.95 | |
| Libertarian | Ed Nagel | 4,798 | 2.63 | |
| Total votes | 182,217 | 100.0 | ||
| Democratic hold | ||||
1994
| Party | Candidate | Votes | % | |
|---|---|---|---|---|
| Democratic | Bill Richardson (incumbent) | 99,900 | 63.59 | |
| Republican | F. Gregg Bemis, Jr. | 53,515 | 34.06 | |
| Libertarian | Ed Nagel | 3,697 | 2.35 | |
| Total votes | 157,112 | 100.0 | ||
| Democratic hold | ||||
1996
| Party | Candidate | Votes | % | |
|---|---|---|---|---|
| Democratic | Bill Richardson (incumbent) | 124,594 | 67.25 | |
| Republican | Bill Redmond | 56,580 | 30.54 | |
| Libertarian | Ed Nagel | 4,097 | 2.21 | |
| Total votes | 185,271 | 100.0 | ||
| Democratic hold | ||||
1997 (Special)
| Party | Candidate | Votes | % | |||
|---|---|---|---|---|---|---|
| Republican | Bill Redmond | 43,559 | 42.75 | |||
| Democratic | Eric P. Serna | 40,542 | 39.79 | |||
| Green | Carol Miller | 17,101 | 16.78 | |||
| Libertarian | Ed Nagel | 393 | 0.39 | |||
| Reform | Daniel Pearlman | 304 | 0.30 | |||
| Total votes | 101,899 | 100.0 | ||||
| Republican gain from Democratic | ||||||
1998
| Party | Candidate | Votes | % | |||
|---|---|---|---|---|---|---|
| Democratic | Tom Udall | 91,248 | 53.16 | |||
| Republican | Bill Redmond (incumbent) | 74,266 | 43.27 | |||
| Green | Carol Miller | 6,103 | 3.56 | |||
| Write-in | 32 | 0.01 | ||||
| Total votes | 171,649 | 100.0 | ||||
| Democratic gain from Republican | ||||||
2000
| Party | Candidate | Votes | % | |
|---|---|---|---|---|
| Democratic | Tom Udall (incumbent) | 135,040 | 67.18 | |
| Republican | Lisa L. Lutz | 65,979 | 32.82 | |
| Total votes | 201,019 | 100.0 | ||
| Democratic hold | ||||
2002
| Party | Candidate | Votes | % | |
|---|---|---|---|---|
| Democratic | Tom Udall (incumbent) | 122,921 | 100.00 | |
| Total votes | 122,921 | 100.0 | ||
| Democratic hold | ||||
2004
| Party | Candidate | Votes | % | |
|---|---|---|---|---|
| Democratic | Tom Udall (incumbent) | 175,269 | 68.68 | |
| Republican | Gregory M. Tucker | 79,935 | 31.32 | |
| Total votes | 255,204 | 100.0 | ||
| Democratic hold | ||||
2006
| Party | Candidate | Votes | % | |
|---|---|---|---|---|
| Democratic | Tom Udall (incumbent) | 144,880 | 74.64 | |
| Republican | Ronald M. Dolin | 49,219 | 25.36 | |
| Total votes | 194,099 | 100.0 | ||
| Democratic hold | ||||
2008
2008 Primary Election
| Party | Candidate | Votes | % | |
|---|---|---|---|---|
| Democratic | Ben Ray Luján | 26,667 | 41.58 | |
| Democratic | Don Wiviott | 16,314 | 25.44 | |
| Democratic | Benny J. Shendo, Jr. | 10,113 | 15.77 | |
| Democratic | Harry Montoya | 7,205 | 11.23 | |
| Democratic | Jon Adams | 1,993 | 3.11 | |
| Democratic | Rudy Martin | 1,838 | 2.87 | |
| Party | Candidate | Votes | % | |
|---|---|---|---|---|
| Republican | Daniel K. East | 14,767 | 53.89 | |
| Republican | Marco Gonzales | 12,634 | 46.11 | |
2008 General Election
| Party | Candidate | Votes | % | |
|---|---|---|---|---|
| Democratic | Ben Ray Luján | 161,292 | 56.74 | |
| Republican | Daniel K. East | 86,618 | 30.47 | |
| Independent | Carol Miller | 36,348 | 12.79 | |
| Total votes | 284,258 | 100.0 | ||
| Democratic hold | ||||
2010
| Party | Candidate | Votes | % | |
|---|---|---|---|---|
| Democratic | Ben Ray Luján (incumbent) | 120,057 | 56.99 | |
| Republican | Thomas E. Mullins | 90,621 | 43.01 | |
| Total votes | 210,678 | 100.0 | ||
| Democratic hold | ||||
2012
| Party | Candidate | Votes | % | |
|---|---|---|---|---|
| Democratic | Ben Ray Luján (Incumbent) | 167,103 | 63.12 | |
| Republican | Jefferson L. Byrd | 97,616 | 36.88 | |
| Total votes | 264,719 | 100.0 | ||
| Democratic hold | ||||
2014
| Party | Candidate | Votes | % | |
|---|---|---|---|---|
| Democratic | Ben Ray Luján (Incumbent) | 113,249 | 61.52 | |
| Republican | Jefferson Byrd | 70,775 | 38.45 | |
| Republican | Thomas Hook (Write-In) | 52 | 0.03 | |
| Total votes | 184,076 | 100 | ||
| Democratic hold | ||||
2016
| Party | Candidate | Votes | % | |
|---|---|---|---|---|
| Democratic | Ben Ray Luján (Incumbent) | 170,612 | 62.42 | |
| Republican | Michael H. Romero | 102,730 | 37.58 | |
| Total votes | 273,342 | 100 | ||
| Democratic hold | ||||
2018
| Party | Candidate | Votes | % | |
|---|---|---|---|---|
| Democratic | Ben Ray Luján (Incumbent) | 155,201 | 63.04 | |
| Republican | Jerald S. McFall | 76,427 | 31.02 | |
| Libertarian | Christopher Manning | 13,265 | 5.4 | |
| Total votes | 244,893 | 100 | ||
| Democratic hold | ||||
Historical district boundaries
gollark: Oh, or filesystem beeocity.
gollark: That was disdain? I assumed it was keyboard limitations.
gollark: About six of them, yes.
gollark: I also did however.
gollark: Also, it uses insults harvested from a conversation with Andrew *months* ago.
References
- "Partisan Voting Index – Districts of the 115th Congress" (PDF). The Cook Political Report. April 7, 2017. Retrieved April 7, 2017.
- "Pueblos, Tribes & Nations". www.newmexico.org. Retrieved 2018-06-22.
- Presidential Election Results, by district, swingstateproject.com
- https://docs.google.com/spreadsheet/pub?key=0Av8O-dN2giY6dEFCOFZ4ZnlKS0x3M3Y0WHd5aWFDWkE&single=true&gid=0&output=html
- 1982 Election Results
- 1984 Election Results
- 1986 Election Results
- 1988 Election Results
- 1990 Election Results
- 1992 Election Results
- 1994 Election Results
- 1996 Election Results
- 1997 Special Election Results
- 1998 Election Results
- 2000 Election Results
- 2002 Election Results
- 2004 Election Results
- 2006 Election Results
- "2008 Primary Results" (PDF). Archived from the original (PDF) on 2016-10-22. Retrieved 2011-05-11.
- "2008 Primary Results" (PDF). Archived from the original (PDF) on 2016-10-22. Retrieved 2011-05-11.
- 2008 Election Results
- "2010 Election Results" (PDF). Archived from the original (PDF) on 2011-09-27. Retrieved 2011-05-11.
- "Statewide Results". New Mexico Secretary of State. Archived from the original on 2017-12-27.
- "Official Results General Election - November 4, 2014". New Mexico Secretary of State. November 4, 2014. Retrieved January 2, 2015.
- "Election Night Results - November 8, 2016". New Mexico Secretary of State. November 8, 2016. Retrieved 2016-12-07.
This article is issued from Wikipedia. The text is licensed under Creative Commons - Attribution - Sharealike. Additional terms may apply for the media files.