Local government areas of Victoria
This is a list of local government areas (LGAs) in Victoria, sorted by region. Also referred to as municipalities, the 79 Victorian LGAs are classified as cities (34), shires (38), rural cities (6) and boroughs (1). In general, an urban or suburban LGA is called a city and is governed by a City Council, while a rural LGA covering a larger rural area is usually called a shire and is governed by a Shire Council. Local councils have the same administrative functions and similar political structures, regardless of their classification. The sorting of LGAs into regions is for presentation purposes only, and has no legal or administrative significance.

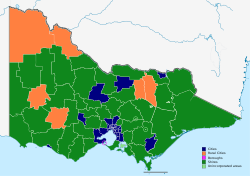
Map of LGAs
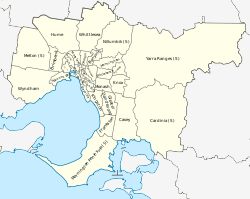
Detail of Local Government Areas in and around Melbourne
Types of LGAs
Local government areas sorted by region
Greater Melbourne
| Local government area | Council seat | Region | Year est. | Land area[1] | Population |
Councillors (2012) |
Notes | Map | |||
|---|---|---|---|---|---|---|---|---|---|---|---|
| km² | sq mi | Density (2018)[1] |
(2013)[2] | (2018)[2][1] | |||||||
| City of Melbourne | Melbourne | Inner Melbourne | 12 August 1842 | 37 | 14 | 4,550 | 118,357 | 169,961 | 11 | Capital city of Victoria. |  |
| City of Port Phillip | St Kilda | Inner Melbourne | 22 June 1994 | 21 | 8 | 5,466 | 102,156 | 113,200 | 7 | Amalgamation of the cities of St Kilda, South Melbourne and Port Melbourne. |  |
| City of Stonnington | Malvern | Inner Melbourne | 22 June 1994 | 26 | 10 | 4,530 | 103,487 | 116,207 | 9 | Amalgamation of the cities of Malvern and Prahran |  |
| City of Yarra | Richmond | Inner Melbourne | 22 June 1994 | 20 | 8 | 5,041 | 83,962 | 98,521 | 9 | Amalgamation of the cities of Richmond, Collingwood, Fitzroy and Northcote. Parts of Carlton North and Princes Hill were annexed from Melbourne. |  |
| City of Banyule | Greensborough | Metropolitan Melbourne | 15 December 1994 | 63 | 24 | 2,083 | 125,314 | 130,237 | 7 | Amalgamation of the City of Heidelberg and parts of the Shire of Diamond Valley and the Shire of Eltham. |  |
| City of Bayside | Sandringham | Metropolitan Melbourne | 15 December 1994 | 37 | 14 | 2,841 | 98,252 | 105,718 | 7 | Amalgamation of cities of Brighton and Sandringham and parts of the cities of Mordialloc and Moorabbin. |  |
| City of Boroondara | Camberwell | Metropolitan Melbourne | 22 June 1994 | 60 | 23 | 3,013 | 170,485 | 181,289 | 10 | Amalgamation of the cities of Camberwell, Kew and Hawthorn. |  |
| City of Darebin | Preston | Metropolitan Melbourne | 22 June 1994 | 54 | 21 | 3,022 | 147,272 | 161,609 | 9 | Amalgamation of the cities of Northcote and Preston. |  |
| City of Glen Eira | Caulfield North | Metropolitan Melbourne | 15 December 1994 | 39 | 15 | 3,977 | 141,260 | 153,858 | 9 | Amalgamation of the city of Caulfield and parts of the city of Morabbin. |  |
| City of Hobsons Bay | Altona | Metropolitan Melbourne | 22 June 1994 | 64 | 25 | 1,502 | 89,188 | 96,470 | 7 | Amalgamation of the City of Williamstown and the City of Altona |  |
| City of Kingston | Cheltenham | Metropolitan Melbourne | 15 December 1994 | 91 | 35 | 1,789 | 152,336 | 163,431 | 9 | Amalgamation of the City of Chelsea and parts of the City of Mordialloc, City of Moorabbin, City of Oakleigh and City of Springvale. |  |
| City of Manningham | Doncaster | Metropolitan Melbourne | 15 December 1994 | 113 | 44 | 1,107 | 118,357 | 125,508 | 9 |  | |
| City of Maribyrnong | Footscray | Metropolitan Melbourne | 15 December 1994 | 31 | 12 | 2,927 | 79,782 | 91,387 | 7 | Amalgamation of the City of Footscray and parts of the City of Sunshine. |  |
| City of Monash | Glen Waverley | Metropolitan Melbourne | 15 December 1994 | 82 | 32 | 2,455 | 183,255 | 200,077 | 11 | The city was formed from the merger of the City of Oakleigh and the City of Waverley. |  |
| City of Moonee Valley | Moonee Ponds | Metropolitan Melbourne | 15 December 1994 | 43 | 17 | 2,741 | 115,464 | 127,883 | 9 | Amalgamation of the City of Essendon and parts of the City of Keilor |  |
| City of Moreland | Coburg | Metropolitan Melbourne | 22 June 1994 | 51 | 20 | 3,567 | 160,282 | 181,725 | 11 | Amalgamation of the City of Brunswick, City of Coburg and part of the City of Broadmeadows |  |
| City of Whitehorse | Nunawading | Metropolitan Melbourne | 15 December 1994 | 64 | 25 | 2,741 | 162,081 | 176,196 | 10 | Amalgamation of the City of Box Hill and city of Nunawading |  |
| City of Brimbank | Sunshine | Outer Metropolitan | 15 December 1994 | 123 | 47 | 1,691 | 196,169 | 208,714 | 11 | Amalgamation of the cities of Keilor and Sunshine |  |
| Shire of Cardinia | Officer | Outer Metropolitan | 15 December 1994 | 1,283 | 495 | 84 | 84,591 | 107,120 | 9 | Amalgamation of the Shire of Pakenham, City of Cranbourne and parts of the Shire of Sherbrooke |  |
| City of Casey | Narre Warren | Outer Metropolitan | 15 December 1994 | 409 | 158 | 831 | 278,023 | 340,419 | 11 | Amalgamation of the City of Berwick with parts of the Shire of Cranbourne |  |
| City of Frankston | Frankston | Outer Metropolitan | 15 December 1994 | 130 | 50 | 1,095 | 134,351 | 141,845 | 9 |  | |
| City of Greater Dandenong | Dandenong | Outer Metropolitan | 15 December 1994 | 130 | 50 | 1,282 | 148,502 | 166,094 | 11 | Amalgamation of the City of Springvale and City of Dandenong |  |
| City of Hume | Broadmeadows | Outer Metropolitan | 15 December 1994 | 504 | 195 | 445 | 184,873 | 224,394 | 11 |  | |
| City of Knox | Wantirna South | Outer Metropolitan | 16 October 1963 | 114 | 44 | 1,433 | 156,347 | 163,203 | 9 |  | |
| City of Maroondah | Ringwood East | Outer Metropolitan | 15 December 1994 | 61 | 24 | 1,913 | 109,781 | 117,498 | 9 | Amalgamation of the City of Ringwood and City of Croydon |  |
| City of Melton | Melton | Outer Metropolitan | 16 September 1862 | 528 | 204 | 297 | 123,936 | 156,713 | 7 |  | |
| Shire of Mornington Peninsula | Rosebud | Outer Metropolitan | 15 December 1994 | 724 | 280 | 229 | 154,001 | 165,822 | 11 | Amalgamation of the shires of Flinders, Hastings and Mornington. |  |
| Shire of Nillumbik | Greensborough | Outer Metropolitan | 15 December 1994 | 432 | 167 | 150 | 63,174 | 64,941 | 7 |  | |
| City of Whittlesea | South Morang | Outer Metropolitan | 12 December 1862 | 490 | 189 | 456 | 179,272 | 223,322 | 11 |  | |
| City of Wyndham | Werribee | Outer Metropolitan | 6 October 1862 | 542 | 209 | 471 | 190,211 | 255,322 | 11 |  | |
| Shire of Yarra Ranges | Lilydale | Outer Metropolitan | 15 December 1994 | 2,468 | 953 | 64 | 150,902 | 158,173 | 9 | Amalgamation of parts of the Shire of Lillydale, Shire of Healesville, Shire of Upper Yarra and parts of the Shire of Sherbrooke. |  |
Southwest
| Local government area | Council seat | Year est. | Land area[1] | Population |
Councillors (2012) |
Notes | Map | ||
|---|---|---|---|---|---|---|---|---|---|
| km² | sq mi | (2013)[2] | (2018)[2][1] | ||||||
| Colac Otway Shire | Colac | 1994 | 3,438 | 1,327 | 21,035 | 21,503 | 7 | 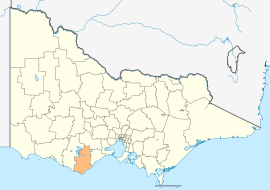 | |
| Golden Plains Shire | Bannockburn | 1994 | 2,703 | 1,044 | 20,362 | 23,120 | 7 | 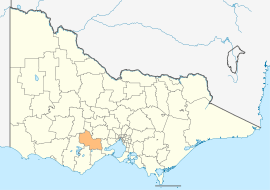 | |
| City of Greater Geelong | Geelong | 1993 | 1,248 | 482 | 223,357 | 252,217 | 13 | 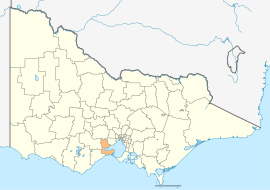 | |
| Borough of Queenscliffe | Queenscliff | 1863 | 8.6 | 3 | 3,002 | 2,982 | 5 | 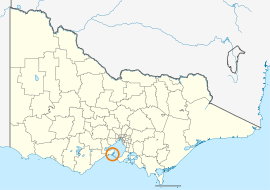 | |
| Surf Coast Shire | Torquay | 1994 | 1,553 | 600 | 28,228 | 32,251 | 9 | 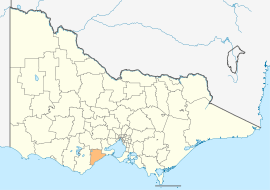 | |
Central Highlands and Goldfields
| Local government area | Council seat | Year est. | Land area[1] | Population |
Councillors (2012) |
Notes | Map | ||
|---|---|---|---|---|---|---|---|---|---|
| km² | sq mi | (2013)[2] | (2018)[2][1] | ||||||
| City of Ballarat | Ballarat | 1994 | 739 | 285 | 98,344 | 107,325 | 9 |  | |
| Shire of Central Goldfields | Maryborough | 1995 | 1,533 | 592 | 12,815 | 13,209 | 7 | 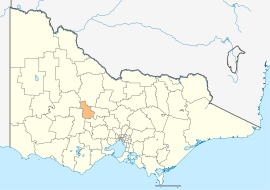 | |
| City of Greater Bendigo | Bendigo | 1994 | 3,000 | 1,158 | 105,957 | 116,045 | 9 | 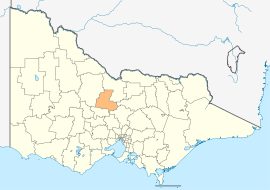 | |
| Shire of Hepburn | Daylesford | 1995 | 1,473 | 569 | 15,022 | 15,812 | 7 | 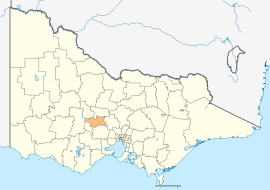 | |
| Shire of Loddon | Wedderburn | 1995 | 6,696 | 2,585 | 7,518 | 7,513 | 5 | 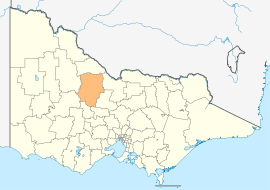 | |
| Shire of Macedon Ranges | Kyneton | 1994 | 1,748 | 675 | 44,595 | 49,388 | 9 | 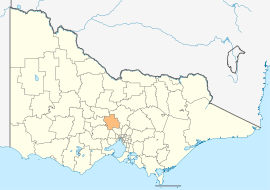 | |
| Shire of Mitchell | Broadford | 1994 | 2,862 | 1,105 | 37,788 | 44,299 | 9 |  | |
| Shire of Moorabool | Ballan | 1994 | 2,111 | 815 | 30,410 | 34,158 | 7 | 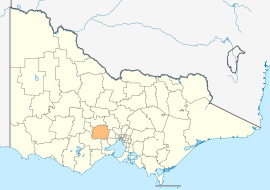 | |
| Shire of Mount Alexander | Castlemaine | 1995 | 1,530 | 591 | 18,247 | 19,514 | 7 |  | |
Goulburn Valley
| Local government area | Council seat | Year est. | Land area[1] | Population |
Councillors (2012) |
Notes | Map | ||
|---|---|---|---|---|---|---|---|---|---|
| km² | sq mi | (2013)[2] | (2018)[2][1] | ||||||
| Shire of Campaspe | Echuca | 1994 | 4,519 | 1,745 | 37,213 | 37,592 | 9 | 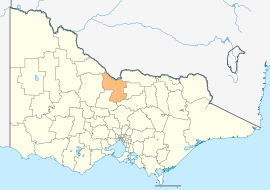 | |
| City of Greater Shepparton | Shepparton | 1994 | 2,422 | 935 | 63,244 | 66,007 | 7 | 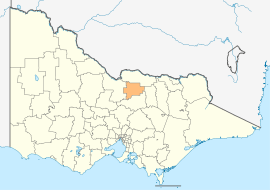 | |
| Shire of Moira | Cobram | 1994 | 4,046 | 1,562 | 25,401 | 29,799 | 9 | 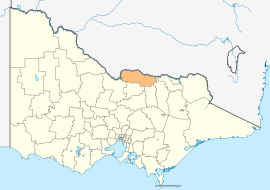 | |
| Shire of Strathbogie | Euroa | 1994 | 3,303 | 1,275 | 9,119 | 10,645 | 7 | 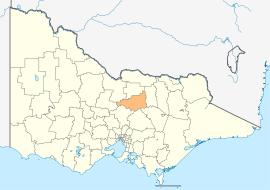 | |
Northeast
| Local government area | Council seat | Year est. | Land area[1] | Population |
Councillors (2012) |
Notes | Map | ||
|---|---|---|---|---|---|---|---|---|---|
| km² | sq mi | (2013)[2] | (2018)[2][1] | ||||||
| Alpine Shire | Bright | 1994 | 4,788 | 1,849 | 12,283 | 12,730 | 7 | 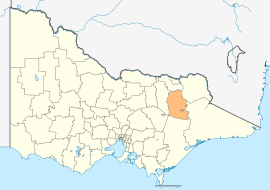 | |
| Rural City of Benalla | Benalla | 2002 | 2,353 | 908 | 13,878 | 14,024 | 7 | 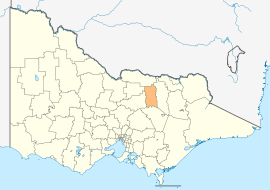 | |
| Shire of Indigo | Beechworth | 1994 | 2,040 | 788 | 15,605 | 16,490 | 7 | 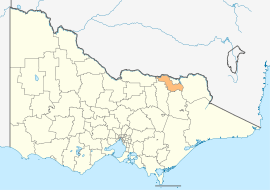 | |
| Shire of Mansfield | Mansfield | 2002 | 3,844 | 1,484 | 8,276 | 8,979 | 5 | 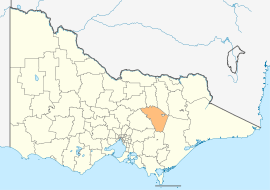 | |
| Shire of Murrindindi | Alexandra | 1994 | 3,880 | 1,498 | 13,563 | 14,478 | 7 | 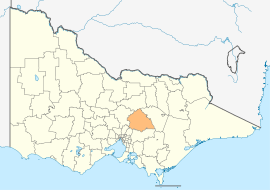 | |
| Shire of Towong | Tallangatta | 1994 | 6,675 | 2,577 | 5,961 | 6,054 | 5 | 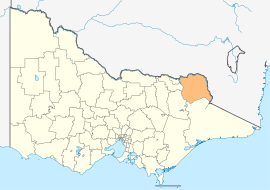 | |
| Rural City of Wangaratta | Wangaratta | 1997 | 3,645 | 1,407 | 27,650 | 29,087 | 7 | 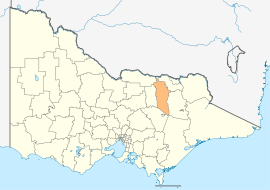 | |
| City of Wodonga | Wodonga | 1876 | 433 | 167 | 37,575 | 41,429 | 7 | 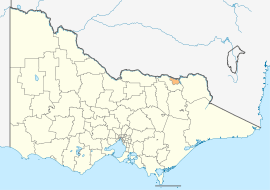 | |
Gippsland
| Local government area | Council seat | Year est. | Land area[1] | Population |
Councillors (2012) |
Notes | Map | ||
|---|---|---|---|---|---|---|---|---|---|
| km² | sq mi | (2013)[2] | (2018)[2][1] | ||||||
| Bass Coast Shire | Wonthaggi | 1994 | 866 | 334 | 31,331 | 35,327 | 7 | 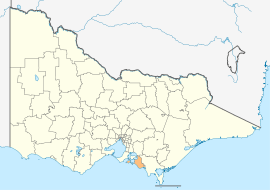 | |
| Shire of Baw Baw | Warragul | 1994 | 4,028 | 1,555 | 45,627 | 52,015 | 9 |  | |
| Shire of East Gippsland | Bairnsdale | 1994 | 20,940 | 8,085 | 43,809 | 46,818 | 9 | 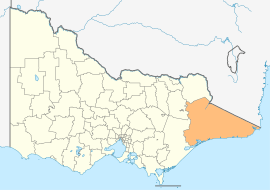 | |
| City of Latrobe | Morwell | 1994 | 1,426 | 551 | 74,124 | 75,211 | 9 |  | |
| South Gippsland Shire | Leongatha | 1994 | 3,435 | 1,326 | 28,273 | 29,579 | 9 |  | |
| Shire of Wellington | Sale | 1994 | 10,817 | 4,176 | 42,721 | 44,019 | 9 | 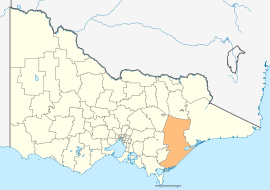 | |
Western District
| Local government area | Council seat | Year est. | Land area[1] | Population |
Councillors (2012) |
Notes | Map | ||
|---|---|---|---|---|---|---|---|---|---|
| km² | sq mi | (2013)[2] | (2018)[2][1] | ||||||
| Rural City of Ararat | Ararat | 1994 | 4,211 | 1,626 | 11,490 | 11,795 | 7 | 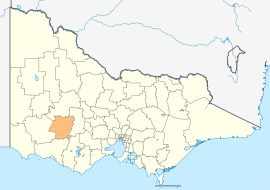 | |
| Corangamite Shire | Camperdown | 1994 | 4,408 | 1,702 | 16,410 | 16,140 | 7 | 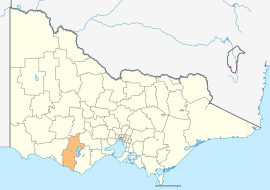 | |
| Shire of Glenelg | Portland | 1994 | 6,219 | 2,401 | 19,797 | 19,665 | 7 | 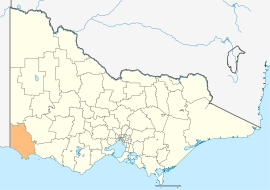 | |
| Shire of Moyne | Port Fairy | 1994 | 5,482 | 2,117 | 16,431 | 16,887 | 7 | 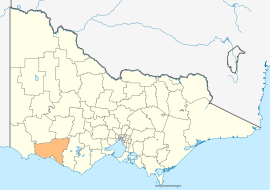 | |
| Pyrenees Shire | Beaufort | 1994 | 3,435 | 1,326 | 6,938 | 7,353 | 5 | 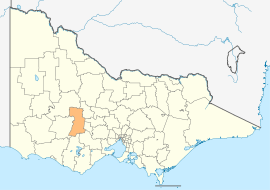 | |
| Shire of Southern Grampians | Hamilton | 1994 | 6,654 | 2,569 | 16,355 | 16,135 | 7 | 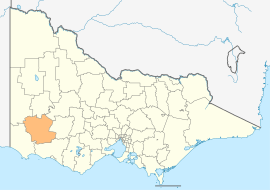 | |
| City of Warrnambool | Warrnambool | 1855 | 121 | 47 | 33,423 | 34,862 | 7 | 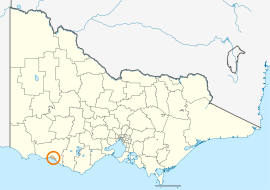 | |
Wimmera
| Local government area | Council seat | Year est. | Land area[1] | Population |
Councillors (2012) |
Notes | Map | ||
|---|---|---|---|---|---|---|---|---|---|
| km² | sq mi | (2013)[2] | (2018)[2][1] | ||||||
| Shire of Hindmarsh | Nhill | 1995 | 7,524 | 2,905 | 5,852 | 5,645 | 6 | 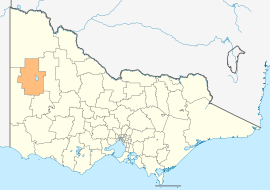 | |
| Rural City of Horsham | Horsham | 1995 | 4,267 | 1,647 | 19,694 | 19,875 | 7 | 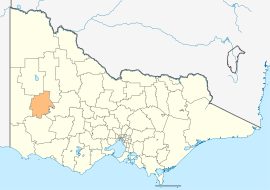 | |
| Shire of Northern Grampians | Stawell | 1995 | 5,730 | 2,212 | 11,880 | 11,431 | 7 |  | |
| Shire of West Wimmera | Edenhope | 1995 | 9,108 | 3,517 | 4,124 | 3,862 | 5 | 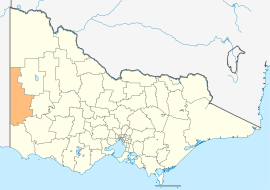 | |
| Shire of Yarriambiack | Warracknabeal | 1995 | 7,326 | 2,829 | 7,032 | 6,658 | 7 | 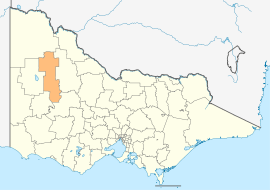 | |
The Mallee
| Local government area | Council seat | Year est. | Land area[1] | Population |
Councillors (2012) |
Notes | Map | ||
|---|---|---|---|---|---|---|---|---|---|
| km² | sq mi | (2013)[2] | (2018)[2][1] | ||||||
| Shire of Buloke | Wycheproof | 1995 | 8,000 | 3,089 | 6,388 | 6,184 | 7 |  | |
| Shire of Gannawarra | Kerang | 1995 | 3,735 | 1,442 | 10,526 | 10,547 | 7 |  | |
| Rural City of Mildura | Mildura | 1995 | 22,083 | 8,526 | 53,156 | 55,515 | 9 |  | |
| Rural City of Swan Hill | Swan Hill | 1995 | 6,115 | 2,361 | 21,003 | 20,759 | 7 |  | |
gollark: Too bad.
gollark: ++roll d20
gollark: Roll to flee the apiopyroforms temporarily.
gollark: ++roll d20
gollark: Roll to summon cryoapioforms.
See also
- Government of Australia
- Australian Local Government Association
- Municipal Association of Victoria
References
- "3218.0 – Regional Population Growth, Australia, 2017-18: Population Estimates by Local Government Area (ASGS 2018), 2017 to 2018". Australian Bureau of Statistics. Australian Bureau of Statistics. 27 March 2019. Retrieved 25 October 2019. Estimated resident population, 30 June 2018.
- "People: Population: ERP by LGA (ASGS 2018), 2001 to 2018". ABS.Stat. Australian Bureau of Statistics. 27 March 2019. Retrieved 29 November 2019.
This article is issued from Wikipedia. The text is licensed under Creative Commons - Attribution - Sharealike. Additional terms may apply for the media files.