Laur, Nueva Ecija
Laur, officially the Municipality of Laur (Tagalog: Bayan ng Laur), is a 3rd class municipality in the province of Nueva Ecija in Central Luzon region of Philippines. According to the 2015 census, it has a population of 35,656 people.[3]
Laur | |
|---|---|
| Municipality of Laur | |
Laur Public Market | |
 Seal | |
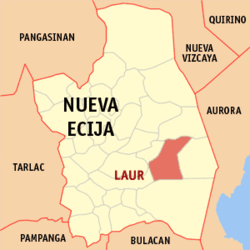
 Map of Nueva Ecija with Laur highlighted | |
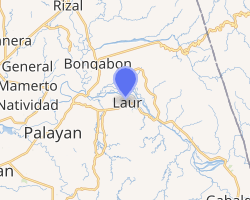
OpenStreetMap 
| |
.svg.png) Laur Location within the Philippines | |
| Coordinates: 15°35′N 121°11′E | |
| Country | |
| Region | Central Luzon (Region III) |
| Province | Nueva Ecija |
| District | 3rd District |
| Founded | January 1, 1917 |
| Barangays | 17 (see Barangays) |
| Government | |
| • Type | Sangguniang Bayan |
| • Mayor | Alexander A. Daus |
| • Vice Mayor | John Joe V. Samano |
| • Congressman | Rosanna V. Vergara |
| • Electorate | 22,596 voters (2019) |
| Area | |
| • Total | 295.88 km2 (114.24 sq mi) |
| Population (2015 census)[3] | |
| • Total | 35,656 |
| • Density | 120/km2 (310/sq mi) |
| • Households | 8,522 |
| Economy | |
| • Income class | 3rd municipal income class |
| • Poverty incidence | 20.99% (2015)[4] |
| • Revenue (₱) | 112,429,072.62 (2016) |
| Time zone | UTC+8 (PST) |
| ZIP code | 3129 |
| PSGC | |
| IDD : area code | +63 (0)44 |
| Climate type | tropical monsoon climate |
| Native languages | Tagalog Ilocano |
The National Penitentiary (New Bilibid Prisons), currently housed in Muntinlupa City of Metro Manila, is scheduled for relocation to Barangay San Isidro.[5][6]
History
In 1971, during the conjugal dictatorship, Senators Benigno Aquino, Jr. and José Diokno were kept in solitary confinement for twenty-two days at Fort Magsaysay in Laur by the government of President Ferdinand Marcos.
Barangays
Laur is politically subdivided into 17 barangays.
- Barangay 1 (Poblacion)
- Barangay 2 (Poblacion)
- Barangay 3 (Poblacion)
- Barangay 4 (Poblacion)
- Betania
- Canantong
- Nauzon
- Pangarulong
- Pinagbayanan
- Sagana
- San Felipe (Makalaw)
- San Fernando (Sorgue)
- San Isidro
- San Josef (Ariendo)
- San Juan
- San Vicente
- Siclong
Climate
| Climate data for Laur, Nueva Ecija | |||||||||||||
|---|---|---|---|---|---|---|---|---|---|---|---|---|---|
| Month | Jan | Feb | Mar | Apr | May | Jun | Jul | Aug | Sep | Oct | Nov | Dec | Year |
| Average high °C (°F) | 27 (81) |
28 (82) |
29 (84) |
31 (88) |
31 (88) |
30 (86) |
30 (86) |
30 (86) |
29 (84) |
29 (84) |
29 (84) |
27 (81) |
29 (85) |
| Average low °C (°F) | 20 (68) |
20 (68) |
21 (70) |
22 (72) |
24 (75) |
24 (75) |
24 (75) |
24 (75) |
24 (75) |
23 (73) |
22 (72) |
21 (70) |
22 (72) |
| Average precipitation mm (inches) | 25 (1.0) |
26 (1.0) |
18 (0.7) |
24 (0.9) |
91 (3.6) |
145 (5.7) |
149 (5.9) |
122 (4.8) |
120 (4.7) |
128 (5.0) |
61 (2.4) |
52 (2.0) |
961 (37.7) |
| Average rainy days | 7.7 | 5.7 | 6.8 | 8.0 | 18.2 | 22.1 | 24.3 | 23.4 | 22.7 | 17.5 | 10.0 | 9.4 | 175.8 |
| Source: Meteoblue[7] | |||||||||||||
Demographics
Aerial view of Laur with Dingalan Bay in the distant background
| Year | Pop. | ±% p.a. |
|---|---|---|
| 1918 | 3,207 | — |
| 1939 | 13,634 | +7.13% |
| 1948 | 16,964 | +2.46% |
| 1960 | 11,165 | −3.43% |
| 1970 | 14,085 | +2.35% |
| 1975 | 16,896 | +3.72% |
| 1980 | 17,729 | +0.97% |
| 1990 | 21,464 | +1.93% |
| 1995 | 25,143 | +3.01% |
| 2000 | 26,902 | +1.46% |
| 2007 | 30,997 | +1.97% |
| 2010 | 32,205 | +1.40% |
| 2015 | 35,656 | +1.96% |
| Source: Philippine Statistics Authority[3][8][9][10] | ||
gollark: Of course.
gollark: I was analyzing the possible things I could replace my old HP tower with (as of now it is not replaced but oh well), see, and there were two main options:- a raspberry pi + SSD + power supply + HDMI adapter thing for the screen + SSD case- literally my desktop with the GPU replaced with a fanless one
gollark: observe, transcoded video™
gollark: I primarily went for not using a pi because it was somehow more expensive (factoring in all the additional hardware) and because sometimes I run really heavy tasks like video transcoding and minecraft servers.
gollark: See, they can run off battery packs since they're low-power, meaning no nonsense like "power cuts" disrupting uptime.
See also
References
- "Municipality". Quezon City, Philippines: Department of the Interior and Local Government. Retrieved 31 May 2013.
- "Province: Nueva Ecija". PSGC Interactive. Quezon City, Philippines: Philippine Statistics Authority. Retrieved 12 November 2016.
- Census of Population (2015). "Region III (Central Luzon)". Total Population by Province, City, Municipality and Barangay. PSA. Retrieved 20 June 2016.
- "PSA releases the 2015 Municipal and City Level Poverty Estimates". Quezon City, Philippines. Retrieved 1 January 2020.
- DOJ to transfer national prison to Bilibid, Philstar.
- National enitentiary relocation
- "Laur: Average Temperatures and Rainfall". Meteoblue. Retrieved 4 May 2020.
- Census of Population and Housing (2010). "Region III (Central Luzon)". Total Population by Province, City, Municipality and Barangay. NSO. Retrieved 29 June 2016.
- Censuses of Population (1903–2007). "Region III (Central Luzon)". Table 1. Population Enumerated in Various Censuses by Province/Highly Urbanized City: 1903 to 2007. NSO.
- "Province of Nueva Ecija". Municipality Population Data. Local Water Utilities Administration Research Division. Retrieved 17 December 2016.
External links
| Wikimedia Commons has media related to Laur, Nueva Ecija. |
This article is issued from Wikipedia. The text is licensed under Creative Commons - Attribution - Sharealike. Additional terms may apply for the media files.