Langley extrapolation
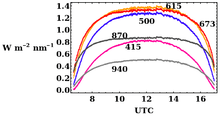
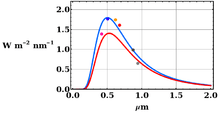
Langley extrapolation is a method for determining the Sun's irradiance at the top of the atmosphere with ground-based instrumentation, and is often used to remove the effect of the atmosphere from measurements of, for example, aerosol optical thickness or ozone.[1][2] It is based on repeated measurements with a sun photometer operated at a given location for a cloudless morning or afternoon as the Sun moves across the sky. It is named for American astronomer and physicist Samuel Pierpont Langley.

Theory
It is known from Beer's law that, for every instantaneous measurement, the direct-Sun irradiance I is linked to the solar extraterrestrial irradiance I0 and the atmospheric optical depth by the following equation:
-
(1)
where m is a geometrical factor accounting for the slant path through the atmosphere, known as the airmass factor. For a plane-parallel atmosphere, the airmass factor is simple to determine if one knows the solar zenith angle θ: m = 1/cos(θ). As time passes, the Sun moves across the sky, and therefore θ and m vary according to known astronomical laws.

By taking the logarithm of the above equation, one obtains:
-
(2)
and if one assumes that the atmospheric disturbance does not change during the observations (which last for a morning or an afternoon), the plot of ln I versus m is a straight line with a slope equal to . Then, by linear extrapolation to m = 0, one obtains I0, i.e. the Sun's radiance that would be observed by an instrument placed above the atmosphere.

The requirement for good Langley plots is a constant atmosphere (constant ). This requirement can be fulfilled only under particular conditions, since the atmosphere is continuously changing. Needed conditions are in particular: the absence of clouds along the optical path, and the absence of variations in the atmospheric aerosol layer. Since aerosols tend to be more concentrated at low altitude, Langley extrapolation is often performed at high mountain sites. Data from NASA Glenn Research Center indicates that the Langley plot accuracy is improved if the data is taken above the tropopause.
Solar cell calibration
A Langley plot can also be used as a method to calculate the performance of solar cells outside the Earth's atmosphere. At the Glenn Research Center, the performance of solar cells is measured as a function of altitude. By extrapolation, researchers determine their performance under space conditions.[3]
Low cost LED-based photometers
Sun photometers using low cost light-emitting diode (LED) detectors in place of optical interference filters and photodiodes have a relatively wide spectral response. They might be used by a globally distributed network of students and teachers to monitor atmospheric haze and aerosols, and can be calibrated using Langley extrapolation.[4] In 2001, David Brooks and Forrest Mims were among many[5][6] to propose detailed procedures to modify the Langley plot in order to account for Rayleigh scattering, and atmospheric refraction by a spherical earth.
Di Justo and Gertz compiled a handbook for using Arduino to develop these photometers in 2012.[7] The handbook refers to in equations (1) and (2), as the AOT (Atmospheric Optical Thickness), and the handbook refers to I0 as the EC (extraterrestrial constant). The manual suggests that once a photometer is constructed, the user waits for a clear day with few clouds, no haze and constant humidity.[8] After the data is fit to equation (1) to find I0, the handbook suggests a daily measurement of I. Both I0 and I are obtained from the LED current (voltage across sensing resistor) by subtracting the dark current:
-
(3)
where is the voltage while the LED is pointing at the Sun, and is the voltage while the LED is kept dark. There is a misprint in the manual regarding the calculation of from this single data point. The correct equation is:[9]
-
(4)
where was calculated on that clear and stable day using Langley extrapolation.
References
- Blumthaler, M.; Ambach, W.; Blasbichler, A. (1997). "Measurements of the spectral aerosol optical depth using a sun photometer". Theoretical and Applied Climatology. 57 (1–2): 95. Bibcode:1997ThApC..57...95B. doi:10.1007/BF00867980.
- Adler-Golden, S. M.; Slusser, J. R. (2007). "Comparison of Plotting Methods for Solar Radiometer Calibration". Journal of Atmospheric and Oceanic Technology. 24 (5): 935. Bibcode:2007JAtOT..24..935A. CiteSeerX 10.1.1.535.6089. doi:10.1175/JTECH2012.1.
- Solar Cell Measurement and Calibration Archived 2014-11-29 at the Wayback Machine. NASA
- Brooks, David R., and Forrest M. Mims. "Development of an inexpensive handheld LED‐based Sun photometer for the GLOBE program." Journal of Geophysical Research: Atmospheres (1984–2012) 106.D5 (2001): 4733-4740. http://onlinelibrary.wiley.com/doi/10.1029/2000JD900545/pdf
- Adler-Golden, S. M., and J. R. Slusser. "Comparison of plotting methods for solar radiometer calibration." Journal of Atmospheric and Oceanic Technology 24.5 (2007): 935-938. http://uvb.nrel.colostate.edu/UVB/publications/Alternative_Langley.pdf They compare the traditional Langley plot with one obtained by plotting ln(I)/m versus 1/m.
- Rollin, E. M. "An introduction to the use of Sun-photometry for the atmospheric correction of airborne sensor data. Activities of the NERC EPFS in support of the NERC ARSF." ARSF Annual Meeting, Keyworth, Nottingham, UK, 22pp. 2000.http://www.ncaveo.ac.uk/site-resources/pdf/cimel.pdf
- Di Justo, Patrick, and Emily Gertz. Atmospheric Monitoring with Arduino: Building Simple Devices to Collect Data about the Environment. " O'Reilly Media, Inc.", 2012. http://it-ebooks.info/book/1961/ see pages 62-63
- The manual also states that the Langley plot could be done under a uniform cloud cover, albeit with less precision
- Note that log A – log B =ln A - ln B. The manual incorrectly states: AOT = log(EC)/log(LED photometer reading)/m