Youden's J statistic
Youden's J statistic (also called Youden's index) is a single statistic that captures the performance of a dichotomous diagnostic test. Informedness is its generalization to the multiclass case and estimates the probability of an informed decision.
Definition
Youden's J statistic is
with the two right-hand quantities being sensitivity and specificity. Thus the expanded formula is:
The index was suggested by W.J. Youden in 1950 [1] as a way of summarising the performance of a diagnostic test. Its value ranges from 0 through 1 (inclusive)[1], and has a zero value when a diagnostic test gives the same proportion of positive results for groups with and without the disease, i.e the test is useless. A value of 1 indicates that there are no false positives or false negatives, i.e. the test is perfect. The index gives equal weight to false positive and false negative values, so all tests with the same value of the index give the same proportion of total misclassified results. While it is technically possible to obtain a value of less than zero from this equation, e.g. Classification yields only False Positives and False Negatives, a value of less than zero just indicates that the positive and negative labels have been switched. After correcting the labels the result will then be in the 0 through 1 range.

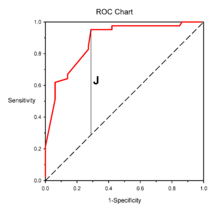
Youden's index is often used in conjunction with receiver operating characteristic (ROC) analysis.[2] The index is defined for all points of an ROC curve, and the maximum value of the index may be used as a criterion for selecting the optimum cut-off point when a diagnostic test gives a numeric rather than a dichotomous result. The index is represented graphically as the height above the chance line, and it is also equivalent to the area under the curve subtended by a single operating point.[3]
Youden's index is also known as deltap [4] and generalizes from the dichotomous to the multiclass case as informedness.[3]
The use of a single index is "not generally to be recommended",[5] but informedness or Youden's index is the probability of an informed decision (as opposed to a random guess) and takes into account all predictions.[3]
An unrelated but commonly used combination of basic statistics from information retrieval is the F-score, being a (possibly weighted) harmonic mean of recall and precision where recall = sensitivity = true positive rate, but specificity and precision are totally different measures. F-score, like recall and precision, only considers the so-called positive predictions, with recall being the probability of predicting just the positive class, precision being the probability of a positive prediction being correct, and F-score equating these probabilities under the effective assumption that the positive labels and the positive predictions should have the same distribution and prevalence,[3] similar to the assumption underlying of Fleiss' kappa. Youden's J, Informedness, Recall, Precision and F-score are intrinsically undirectional, aiming to assess the deductive effectiveness of predictions in the direction proposed by a rule, theory or classifier. Markedness (deltap) is Youden's J used to assess the reverse or abductive direction,[3][6] and matches well human learning of associations; rules and, superstitions as we model possible causation;[4] while correlation and kappa evaluate bidirectionally.
Matthews correlation coefficient is the geometric mean of the regression coefficient of the problem and its dual, where the component regression coefficients of the Matthews correlation coefficient are Markedness (inverse of Youden's J or deltap) and informedness (Youden's J or deltap'). Kappa statistics such as Fleiss' kappa and Cohen's kappa are methods for calculating inter-rater reliability based on different assumptions about the marginal or prior distributions, and are increasingly used as chance corrected alternatives to accuracy in other contexts. Fleiss' kappa, like F-score, assumes that both variables are drawn from the same distribution and thus have the same expected prevalence, while Cohen's kappa assumes that the variables are drawn from distinct distributions and referenced to a model of expectation that assumes prevalences are independent.[6]
When the true prevalences for the two positive variables are equal as assumed in Fleiss kappa and F-score, that is the number of positive predictions matches the number of positive classes in the dichotomous (two class) case, the different kappa and correlation measure collapse to identity with Youden's J, and recall, precision and F-score are similarly identical with accuracy.[3][6]
References
- Youden, W.J. (1950). "Index for rating diagnostic tests". Cancer. 3: 32–35. doi:10.1002/1097-0142(1950)3:1<32::aid-cncr2820030106>3.0.co;2-3. PMID 15405679.
- Schisterman, E.F.; Perkins, N.J.; Liu, A.; Bondell, H. (2005). "Optimal cut-point and its corresponding Youden Index to discriminate individuals using pooled blood samples". Epidemiology. 16 (1): 73–81. doi:10.1097/01.ede.0000147512.81966.ba. PMID 15613948.
- Powers, David M W (2011). "Evaluation: From Precision, Recall and F-Score to ROC, Informedness, Markedness & Correlation". Journal of Machine Learning Technologies. 2 (1): 37–63. hdl:2328/27165.
- Perruchet, P.; Peereman, R. (2004). "The exploitation of distributional information in syllable processing". J. Neurolinguistics. 17 (2–3): 97–119. doi:10.1016/s0911-6044(03)00059-9.
- Everitt B.S. (2002) The Cambridge Dictionary of Statistics. CUP ISBN 0-521-81099-X
- Powers, David M W (2012). The Problem with Kappa. Conference of the European Chapter of the Association for Computational Linguistics. pp. 345–355. hdl:2328/27160.