gnuplot
gnuplot is a command-line program that can generate two- and three-dimensional plots of functions, data, and data fits. The program runs on all major computers and operating systems (Linux, Unix, Microsoft Windows, macOS, and others). It is a program with a fairly long history, dating back to 1986. Despite its name, this software is not part of the GNU Project.
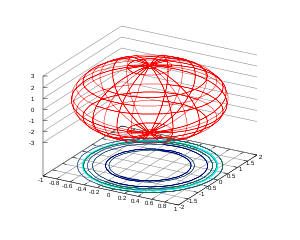 3D rendering of an ellipsoid by gnuplot | |
| Initial release | 1986 |
|---|---|
| Stable release | 5.2.8 (December 1, 2019) [±] |
| Preview release | 5.4 [±] |
| Repository | |
| Written in | C |
| Type | Plotting |
| License | Gnuplot license[1] |
| Website | gnuplot |
Features
gnuplot can produce output directly on screen, or in many formats of graphics files, including Portable Network Graphics (PNG), Encapsulated PostScript (EPS), Scalable Vector Graphics (SVG), JPEG and many others. It is also capable of producing LaTeX code that can be included directly in LaTeX documents, making use of LaTeX's fonts and powerful formula notation abilities. The program can be used both interactively and in batch mode using scripts.[2]
gnuplot can read data in multiple formats, including ability to read data on the fly generated by other programs (piping), create multiple plots on one image, do 2D, 3D, contour plots, parametric equations, supports various linear and non-linear coordinate systems, projections, geographic and time data reading and presentation, box plots of various forms, histograms, labels, and other custom elements on the plot, including shapes, text and images, that can be set manually, computed by script or automatically from input data.
gnuplot also provides scripting capabilities, looping, functions, text processing, variables, macros, arbitrary pre-processing of input data (usually across columns), as well ability to perform non-linear multi-dimensional multi-set weighted data fitting (see Curve fitting and Levenberg–Marquardt algorithm).
The gnuplot core code is programmed in C. Modular subsystems for output via Qt, wxWidgets, and LaTeX/TikZ/ConTeXt are written in C++ and Lua.
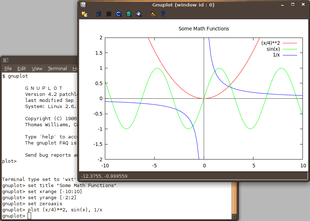
The code below creates the graph to the right.
set title "Some Math Functions"
set xrange [-10:10]
set yrange [-2:2]
set zeroaxis
plot (x/4)**2, sin(x), 1/x
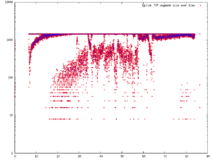 A scatter plot of samples from a text file.
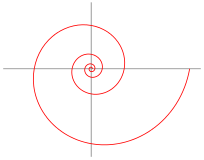 A logarithmic spiral.
The name of this program was originally chosen to avoid conflicts with a program called "newplot", and was originally a compromise between "llamaplot" and "nplot".[3]
Distribution terms
| Author | Thomas Williams, Colin Kelley |
|---|---|
| Published | 1986 – 1993, 1998, 2004 |
| DFSG compatible | Yes |
| FSF approved | Yes |
| OSI approved | Yes |
| GPL compatible | No[4] |
| Copyleft | No |
| Website | https://sourceforge.net/p/gnuplot/gnuplot-main/ci/master/tree/Copyright |
Despite gnuplot's name, it is not named after, part of or related to the GNU Project, nor does it use the GNU General Public License. It was named as part of a compromise by the original authors, punning on gnu (the animal) and newplot.[5]
Official source code to gnuplot is freely redistributable, but modified versions thereof are not. The gnuplot license instead recommends distribution of patches against official releases, optionally accompanied by officially released source code. Binaries may be distributed along with the unmodified source code and any patches applied thereto. Contact information must be supplied with derived works for technical support for the modified software.[1]
Permission to modify the software is granted, but not the right to distribute the complete modified source code. Modifications are to be distributed as patches to the released version.
Despite this restriction, gnuplot is accepted and used by many GNU packages and is widely included in Linux distributions including the stricter ones such as Debian and Fedora. The OSI Open Source Definition and the Debian Free Software Guidelines specifically allow for restrictions on distribution of modified source code, given explicit permission to distribute both patches and source code.
Newer gnuplot modules (e.g. Qt, wxWidgets, and cairo drivers) have been contributed under dual-licensing terms, e.g. gnuplot + BSD or gnuplot + GPL.
GUIs and programs that use gnuplot
Several third-party programs have graphical user interfaces that can be used to generate graphs using gnuplot as the plotting engine. These include:
- gretl, a statistics package for econometrics
- JGNUPlot, a java-based GUI[6]
- Kayali[7] a computer algebra system
- xldlas, an old X11 statistics package[8]
- gnuplotxyz, an old Windows program[9]
- wxPinter, a graphical plot manager for gnuplot[10]
- Maxima is a text-based computer algebra system which itself has several third-party GUIs.
Other programs that use gnuplot include:
- GNU Octave, a mathematical programming language
- statist, a terminal-based program[11]
- gplot.pl provides a simpler command-line interface.[12]
- feedgnuplot provides a plotting of stored and realtime data from a pipe.
- ElchemeaAnalytical,[13] an Impedance spectroscopy plotting and fitting program developed by DTU Energy[14]
- Gnuplot add-in for MS-Excel
Programming and application interfaces
gnuplot can be used from various programming languages to graph data, including Perl (via PDL and other CPAN packages), Python (via gnuplotlib, Gnuplot-py and SageMath), R via (Rgnuplot), Julia (via Gaston.jl), Java (via JavaGnuplotHybrid and jgnuplot), Ruby (via Ruby Gnuplot), Ch (via Ch Gnuplot), Haskell (via Haskell gnuplot), Fortran 95[15], Smalltalk (Squeak and GNU Smalltalk) and Rust (via RustGnuplot).
gnuplot also supports piping, which is typical of scripts.[16] For script-driven graphics, gnuplot is by far the most popular program.
Gnuplot output formats
Gnuplot allows you to represent the results in several ways[17]:[18]
- By console
- Visually on the Web (with output formats like svg, HTML5 ---
- Directly in a file : In this case, GNU allows us to export the final images in a wide variety of different formats. Although we can see all the formats that it supports using the help set term command, output formats such as: aifm,cgi, dumb, eps, gif, gnugraph, jpeg, latex, pdf, png, xlib…..
See also
- List of graphing software
References
- "gnuplot licence".
- How to generate graphs with gnuplot, retrieved 2012-07-19
- Gnuplot FAQ
- "License:Gnuplot". Free Software Foundation. Retrieved 2018-11-19.
- "1.2 How did it come about and why is it called gnuplot?". gnuplot. Retrieved 2015-02-21.
- http://jgp.sourceforge.net/
- http://kayali.sourceforge.net/index.htm
- "Archived copy". Archived from the original on 2014-10-31. Retrieved 2014-10-30.CS1 maint: archived copy as title (link)
- http://www.uni-hamburg.de/Wiss/FB/15/Sustainability/schneider/gnuplot/
- Steingrube, Daniel S. "Steingrube". www.steingrube-home.de. Archived from the original on 2015-10-26. Retrieved 2015-08-21.
- http://wald.intevation.org/projects/statist/
- http://gplot.sourceforge.net/
- https://www.elchemea.com/
- http://www.energy.dtu.dk/english
- Singh, Madhusudan. "gnuplotfortran - the Fortran 95 interface to gnuplot". gnuplotfortran.sourceforge.net. Retrieved 10 May 2016.
- Piping to GNU Plot from C by Amit Saha
- http://www.gnuplot.info/
- http://fm137.ugr.es/imnf/descargas/archivos/manual-gnuplot.pdf
Further reading and external links
| Wikimedia Commons has media related to Gnuplot. |
| Wikibooks has a book on the topic of: gnuplot |
| The Wikibook Ad Hoc Data Analysis From The Unix Command Line has a page on the topic of: Quick Plotting With gnuplot |
- Official website
- Gnuplot on SourceForge.net
- Gnuplot 5: an interactive ebook about gnuplot v.5.
- gnuplotting: a blog of gnuplot examples and tips
- spplotters: a blog of gnuplot examples and tips
- gnuplot surprising: a blog of gnuplot examples and tips
- Gnuplot at Curlie
- Philipp K. Janert (2009). Gnuplot in Action. Manning Publications. ISBN 978-1933988399.
- Lee Phillips (2012). gnuplot Cookbook. Packt Publishing. ISBN 978-1849517249.
- Williams, Thomas; Kelley, Colin (2015). Gnuplot 5.0. Samurai Media Limited. ISBN 978-988-14436-4-9.
- Visualize your data with gnuplot: an IBM tutorial
| Authority control |
|
|---|