Florida's 7th congressional district
Florida's 7th congressional district is a congressional district in the U.S. state of Florida. The district is centered in the north central portion of the state.
| Florida's 7th congressional district | |||
|---|---|---|---|
 Florida's 7th congressional district - since January 3, 2017 | |||
| Representative |
| ||
| Area | 436[1] sq mi (1,130 km2) | ||
| Distribution |
| ||
| Population (2016) | 762,326[3] | ||
| Median income | $61,423[4] | ||
| Ethnicity |
| ||
| Cook PVI | EVEN[5] | ||
The district from 2003 to 2013 consisted of the suburban area between Orlando and Daytona Beach and included St. Augustine, the first post-Columbian settlement in the United States. The district included all of Flagler and St. Johns counties, a very small portion of eastern Putnam County, parts of Volusia County including portions of DeLand, Deltona Ormond Beach and Daytona Beach, much of western Seminole County, and a small, predominantly suburban portion of Orange County.
Following court-ordered redistricting in 2015, the district now includes all of Seminole County and northern Orange County, including much of downtown and northern Orlando and the cities of Maitland and Winter Park. The district is also home to the University of Central Florida - the nation's second largest university as of 2016.
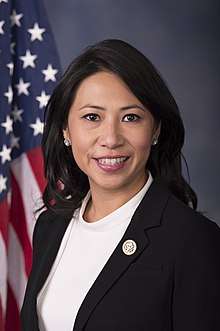
The district is currently represented by Democrat Stephanie Murphy.
List of members representing the district
| Member | Party | Years | Cong ress |
Electoral history | District map | |||||||||||||||||||||||||||||||||||||||||||||||||||||||||||||||||||||||||||||||||||||||||||||
|---|---|---|---|---|---|---|---|---|---|---|---|---|---|---|---|---|---|---|---|---|---|---|---|---|---|---|---|---|---|---|---|---|---|---|---|---|---|---|---|---|---|---|---|---|---|---|---|---|---|---|---|---|---|---|---|---|---|---|---|---|---|---|---|---|---|---|---|---|---|---|---|---|---|---|---|---|---|---|---|---|---|---|---|---|---|---|---|---|---|---|---|---|---|---|---|---|---|---|
| District created January 3, 1953 | ||||||||||||||||||||||||||||||||||||||||||||||||||||||||||||||||||||||||||||||||||||||||||||||||||
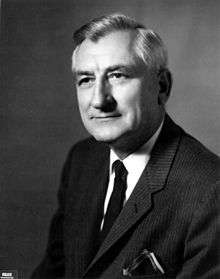
 James A. Haley |
Democratic | January 3, 1953 – January 3, 1973 |
83rd 84th 85th 86th 87th 88th 89th 90th 91st 92nd |
Elected in 1952. Re-elected in 1954. Re-elected in 1956. Re-elected in 1958. Re-elected in 1960. Re-elected in 1962. Re-elected in 1964. Re-elected in 1966. Re-elected in 1968. Re-elected in 1970. Redistricted to the 8th district. |
1953–1973 [data unknown/missing] | |||||||||||||||||||||||||||||||||||||||||||||||||||||||||||||||||||||||||||||||||||||||||||||
 Sam Gibbons |
Democratic | January 3, 1973 – January 3, 1993 |
93rd 94th 95th 96th 97th 98th 99th 100th 101st 102nd |
Redistricted from the 6th district and re-elected in 1972. Re-elected in 1974. Re-elected in 1976. Re-elected in 1978. Re-elected in 1980. Re-elected in 1982. Re-elected in 1984. Re-elected in 1986. Re-elected in 1988. Re-elected in 1990. Redistricted to the 11th district. |
1973–1993 [data unknown/missing] | |||||||||||||||||||||||||||||||||||||||||||||||||||||||||||||||||||||||||||||||||||||||||||||
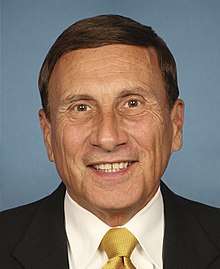
 John Mica |
Republican | January 3, 1993 – January 3, 2017 |
103rd 104th 105th 106th 107th 108th 109th 110th 111th 112th 113th 114th |
Elected in 1992. Re-elected in 1994. Re-elected in 1996. Re-elected in 1998. Re-elected in 2000. Re-elected in 2002. Re-elected in 2004. Re-elected in 2006. Re-elected in 2008. Re-elected in 2010. Re-elected in 2012. Re-elected in 2014. Lost re-election. |
1993–2003 [data unknown/missing] | |||||||||||||||||||||||||||||||||||||||||||||||||||||||||||||||||||||||||||||||||||||||||||||
2003-2013 | ||||||||||||||||||||||||||||||||||||||||||||||||||||||||||||||||||||||||||||||||||||||||||||||||||
2013–2017.tif.jpg) | ||||||||||||||||||||||||||||||||||||||||||||||||||||||||||||||||||||||||||||||||||||||||||||||||||
 Stephanie Murphy |
Democratic | January 3, 2017 – present |
115th 116th |
Elected in 2016. Re-elected in 2018. |
2017–present | |||||||||||||||||||||||||||||||||||||||||||||||||||||||||||||||||||||||||||||||||||||||||||||
Recent results in statewide elections
| Year | Office | Results |
|---|---|---|
| 2000 | President | George W. Bush 53 - Al Gore 45% |
| 2004 | President | George W. Bush 57 - John Kerry 43% |
| 2008 | President | John McCain 53 - Barack Obama 45% |
| 2012 | President | Barack Obama 49.4 - Mitt Romney 49.4% |
| 2016 | President | Hillary Clinton 51.4%- Donald Trump 44.1% |
Election results
2002
| Party | Candidate | Votes | % | |
|---|---|---|---|---|
| Republican | John L. Mica* | 142,147 | 59.58 | |
| Democratic | Wayne Hogan | 96,444 | 40.42 | |
| Total votes | 238,591 | 100.00 | ||
| Republican hold | ||||
2004
| Party | Candidate | Votes | % | |
|---|---|---|---|---|
| Republican | John L. Mica* | 100.00 | ||
| Total votes | 100.00 | |||
| Republican hold | ||||
2006
| Party | Candidate | Votes | % | |
|---|---|---|---|---|
| Republican | John L. Mica* | 149,656 | 59.88 | |
| Democratic | John F. Chagnon | 87,584 | 36.92 | |
| Total votes | 237,240 | 100.00 | ||
| Republican hold | ||||
2008
| Party | Candidate | Votes | % | |
|---|---|---|---|---|
| Republican | John L. Mica* | 238,721 | 62.00 | |
| Democratic | Faye Armitage | 146,292 | 38.00 | |
| Total votes | 385,013 | 100.00 | ||
| Republican hold | ||||
2010
| Party | Candidate | Votes | % | |
|---|---|---|---|---|
| Republican | John L. Mica* | 185,470 | 69.03 | |
| Democratic | Heather Beaven | 83,206 | 30.97 | |
| Total votes | 268,676 | 100.00 | ||
| Republican hold | ||||
2012
| Party | Candidate | Votes | % | |
|---|---|---|---|---|
| Republican | John Mica (Incumbent) | 185,518 | 58.7 | |
| Democratic | Jason H. Kenall | 130,479 | 41.3 | |
| Write-in | Fred Marra | 13 | 0.0 | |
| Total votes | 316,010 | 100.0 | ||
| Republican hold | ||||
2014
| Party | Candidate | Votes | % | |
|---|---|---|---|---|
| Republican | John Mica | 144,474 | 63.60 | |
| Democratic | Wes Neuman | 73,011 | 32.14 | |
| No Party Affiliation | Al Krulick | 9,679 | 4.26 | |
| Total votes | 227,164 | 100.00 | ||
| Republican hold | ||||
2016
| Party | Candidate | Votes | % | |
|---|---|---|---|---|
| Democratic | Stephanie Murphy | 182,039 | 51.47 | |
| Republican | John Mica | 171,583 | 48.52 | |
| No Party Affiliation | Mike Plaskon | 33 | 0.01 | |
| Total votes | 353,655 | 100 | ||
| Democratic gain from Republican | ||||
2018
| Party | Candidate | Votes | % | |
|---|---|---|---|---|
| Democratic | Stephanie Murphy (Incumbent) | 183,113 | 57.7 | |
| Republican | Mike Miller | 134,285 | 42.3 | |
| Total votes | 317,398 | 100.00 | ||
| Democratic hold | ||||
References
- "Congressional Plan--SC14-1905 (Ordered by The Florida Supreme Court, 2-December-2015)" (PDF). Florida Senate Committee on Reapportionment. Retrieved 11 January 2017.
- https://www.census.gov/geo/maps-data/data/cd_state.html
- https://www.census.gov/mycd/?st=12&cd=07
- https://www.census.gov/mycd/?st=12&cd=07
- "Partisan Voting Index – Districts of the 115th Congress" (PDF). The Cook Political Report. April 7, 2017. Retrieved April 7, 2017.
- Martis, Kenneth C. (1989). The Historical Atlas of Political Parties in the United States Congress. New York: Macmillan Publishing Company.
- Martis, Kenneth C. (1982). The Historical Atlas of United States Congressional Districts. New York: Macmillan Publishing Company.
- Congressional Biographical Directory of the United States 1774–present