Electricity sector in Belgium
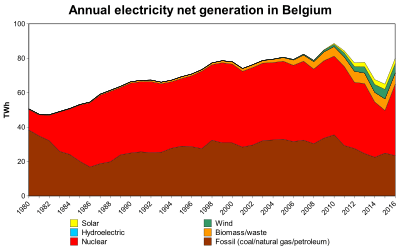
The electricity sector in Belgium describes electricity in Belgium. Production by power source in 2009 was 53% nuclear, 40% fossil electricity and 7% renewable electricity. 2% of production was exported in 2009. In 2008 import was 11%. Belgium is highly nuclear dependent country where the share of renewable electricity has been low. The share of renewable electricity was about 2% in 2005. Plan for 2020 is wind 10.5 TWh (9.5%), biomass 11 TWh and PV 1 TWh.

Total electricity consumption was 91 TWh in 2008. Finland had about same consumption 87 TWh with only half of Belgium’s population.[1] In 2009 consumption was 8,152 kWh per person.
Electricity per capita by power source
In 2008 Belgium consumed electricity 8,961 kWh/person. EU15 average was 7,409 kWh/person.[2]
| Electricity per capita in Belgium(kWh/person)[2] | ||||||||||||
|---|---|---|---|---|---|---|---|---|---|---|---|---|
| Use | Production | Import/Exp. | Imp./Exp. % | Fossil | Nuclear | Nuc. % | Other RE | Bio+waste | Wind | Non RE use* | RE % | |
| 2004 | 8,967 | 8,219 | 749 | 8.3% | 3,323 | 4,540 | 50.6 % | 168 | 187 | 8,612 | 4.0% | |
| 2005 | 8,913 | 8,311 | 602 | 6.8 % | 3,351 | 4,546 | 51.0% | 200 | 215 | 8,499 | 4.7% | |
| 2006 | 9,111 | 8,466 | 645 | 7.1% | 3,343 | 4,581 | 50.3 % | 234 | 308 | 8,568 | 5.9% | |
| 2008 | 8,961 | 7,962 | 999 | 11.1% | 2,997 | 4,295 | 47.9 % | 252 | 418 | 8,291 | 7.5% | |
| 2009 | 8,152 | 8,319 | -167 | -2.0 % | 3,330 | 4,388 | 53.8% | 74* | 436 | 93* | 7,549 | 7,4% |
| * Other RE is waterpower, solar and geothermal electricity and wind power until 2008 * Non RE use = use – production of renewable electricity * RE % = (production of RE / use) * 100% Note: European Union calculates the share of renewable energies in gross electrical consumption. | ||||||||||||
Import
The electricity import in Belgium was 11 TWh in 2008. This was seventh highest import in the world behind Brazil (42 TWh), Italy (40 TWh), USA (33 TWh), the Netherlands (16 TWh), Finland (13 TWh), and the UK (11 TWh).[1]
Most recent data shows that this deficit has been reduced to 9.6 TWh in 2013.
Nuclear power
Domestically produced nuclear power accounted for 53% of the electricity consumption in Belgium during 2009. This is among the highest nuclear dependencies in Europe, less than France (79%) but more than Switzerland (40%) and Sweden (35-40%). The current plan is to phase out nuclear power by 2025. Several scenarios exist on how this phase-out can occur.[3] Most likely resulting in an increase of greenhouse gases emitted compared to the current situation.
Renewable electricity
In 2015, the installed capacities were:
- 3252 MW for solar power
- 2229 MW for wind power
- 1422 MW for hydro-electric power
- 1284 MW for biomass[4]
According to the National Renewable Energy Action Plan Belgium has 13% RES target in 2020, up from 2% in 2005. Renewable electricity will represent the largest share of RES in 2020 (20.9%). The annual production in 2020 is estimated to be:
- 10.5 TWh for wind power
- 11 TWh for biomass
- 1 TWh for PV solar
Wind energy will cover 9.5% of electricity. Wind capacity is estimated as 4,320 MW in 2020.[5]
Global warming
Emissions of carbon dioxide in total, per capita in 2007 were 10 tons CO2 compared to EU 27 average 7.9 tons CO2.[6]
See also
| Wikimedia Commons has media related to Electricity in Belgium. |
- Energy in Belgium
- Nuclear power in Belgium
- Wind power in Belgium
References
- IEA Key stats 2010 pages 27, 48
- Energy in Sweden, Facts and figures, The Swedish Energy Agency, (in Swedish: Energiläget i siffror), Table: Specific electricity production per inhabitant with breakdown by power source (kWh/person), Source: IEA/OECD 2006 T23 Archived July 4, 2011, at the Wayback Machine, 2007 T25 Archived July 4, 2011, at the Wayback Machine, 2008 T26 Archived July 4, 2011, at the Wayback Machine, 2009 T25 Archived January 20, 2011, at the Wayback Machine and 2010 T49 Archived October 16, 2013, at the Wayback Machine.
- Policy Trade-offs for the Belgian electricity system
- Breakdown of power production in Belgium in 2013
- EWEA March 2011 pages tables 43-47, national plan 58
- Energy in Sweden 2010, Table 1: Emissions of carbon dioxide in total, per capita and per GDP in EU and OECD countries, 2007 2010 Table 1 Archived October 16, 2013, at the Wayback Machine