Demography of Coventry
Coventry, England is an ethnically and culturally diverse city. It is the fifteenth most populous city in the United Kingdom.

Population density in the 2011 census in Coventry.
Population
Coventry's total population, according to the 2011 UK census, was 316,960. The population density was 3,408 people per square km.
Ethnicity
The following table shows the ethnic group of respondents in the 2001 and 2011 censuses in Coventry.
| Ethnic Group | 2001[1] | 2011[2] | ||
|---|---|---|---|---|
| Number | % | Number | % | |
| White: British | 235,632 | 78.32% | 211,188 | 66.63% |
| White: Irish | 10,401 | 3.46% | 7,305 | 2.30% |
| White: Gypsy or Irish Traveller[note 1] | 151 | 0.05% | ||
| White: Other | 6,610 | 2.20% | 15,385 | 4.85% |
| White: Total | 252,643 | 83.98% | 234,029 | 73.84% |
| Asian or Asian British: Indian | 24,177 | 8.04% | 27,751 | 8.76% |
| Asian or Asian British: Pakistani | 6,169 | 2.05% | 9,510 | 3.00% |
| Asian or Asian British: Bangladeshi | 1,741 | 0.58% | 2,951 | 0.93% |
| Asian or Asian British: Chinese[note 2] | 2,183 | 0.73% | 3,728 | 1.18% |
| Asian or Asian British: Other Asian | 1,823 | 0.61% | 7,658 | 2.42% |
| Asian or Asian British: Total | 36,093 | 12.00% | 51,598 | 16.28% |
| Black or Black British: Caribbean | 3,314 | 1.10% | 3,317 | 1.05% |
| Black or Black British: African | 1,679 | 0.56% | 12,836 | 4.05% |
| Black or Black British: Other Black | 419 | 0.14% | 1,611 | 0.51% |
| Black or Black British: Total | 5,412 | 1.80% | 17,764 | 5.60% |
| Mixed: White and Black Caribbean | 2,453 | 0.82% | 3,672 | 1.16% |
| Mixed: White and Black African | 271 | 0.09% | 943 | 0.30% |
| Mixed: White and Asian | 1,605 | 0.53% | 2,388 | 0.75% |
| Mixed: Other Mixed | 834 | 0.28% | 1,227 | 0.39% |
| Mixed: Total | 5,163 | 1.72% | 8,230 | 2.60% |
| Other: Arab[note 3] | 2,020 | 0.64% | ||
| Other: Any other ethnic group | 1,537 | 0.51% | 3,319 | 1.05% |
| Other: Total | 1,537 | 0.51% | 5,339 | 1.68% |
| Total | 300,848 | 100.00% | 316,960 | 100.00% |
Notes for table above
- New category created for the 2011 census
- In 2001, listed under the 'Chinese or other ethnic group' heading.
- New category created for the 2011 census
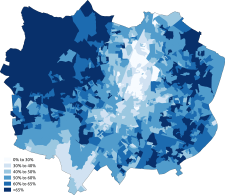
Distribution of ethnic groups in Coventry according to the 2011 census.
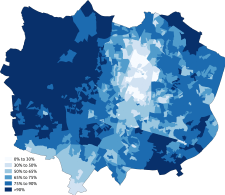 White
White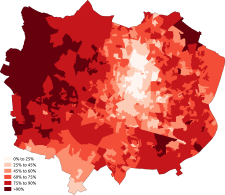 White-British
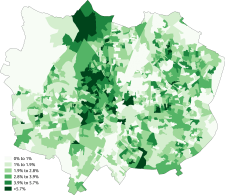 White-Irish
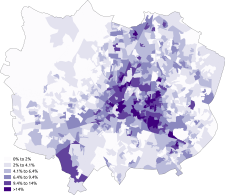 White-Other
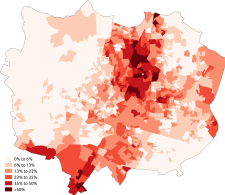 Asian
Asian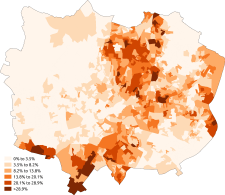 Asian-Indian
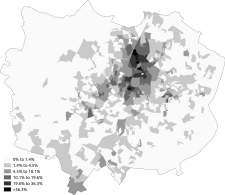 Asian-Pakistani
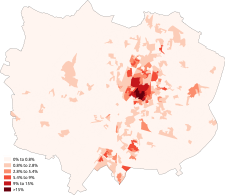 Asian-Bangladeshi
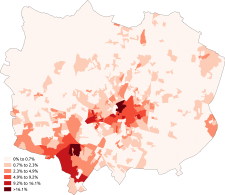 Asian-Chinese
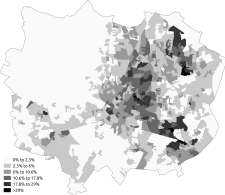 Black
Black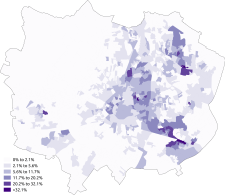 Black-African
 Black-Caribbean
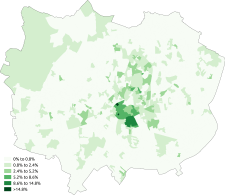 Other-Arab
Languages
The most common main languages spoken in Coventry according to the 2011 census are shown below.[3]
| Rank | Language | Usual residents aged 3+ | Proportion |
|---|---|---|---|
| 1 | English | 261,117 | 86.14% |
| 2 | Punjabi | 6,849 | 2.26% |
| 3 | Polish | 6,161 | 2.03% |
| 4 | Gujarati | 2,523 | 0.83% |
| 5 | Urdu | 2,479 | 0.82% |
| 6 | Arabic | 1,821 | 0.60% |
| 7 | Tamil | 1,445 | 0.48% |
| 8 | Bengali (with Sylheti and Chatgaya) | 1,391 | 0.46% |
| 9 | French | 1,340 | 0.44% |
| 10 | Persian/Farsi | 925 | 0.31% |
| 11 | Kurdish | 895 | 0.30% |
| 12 | Romanian | 883 | 0.29% |
| 13 | Hindi | 784 | 0.26% |
| 14 | Somali | 746 | 0.25% |
| 15 | Latvian | 674 | 0.22% |
| 16 | Russian | 597 | 0.20% |
| 17 | Swahili/Kiswahili | 572 | 0.19% |
| 18 | Shona | 521 | 0.17% |
| 19 | Slovak | 497 | 0.16% |
| 20 | Malayalam | 465 | 0.15% |
| Other | 10,445 | 3.45% |
Religion
The following table shows the religion of respondents in the 2001 and 2011 censuses in Coventry.
| Religion | 2001[4] | 2011[5] | ||
|---|---|---|---|---|
| Number | % | Number | % | |
| Christian | 196,346 | 65.26% | 170,090 | 53.66% |
| Buddhist | 784 | 0.26% | 1,067 | 0.34% |
| Hindu | 7,757 | 2.58% | 11,152 | 3.52% |
| Jewish | 222 | 0.07% | 210 | 0.07% |
| Muslim | 11,686 | 3.88% | 23,665 | 7.47% |
| Sikh | 13,960 | 4.64% | 15,912 | 5.02% |
| Other religion | 733 | 0.24% | 1,641 | 0.52% |
| No religion | 45,314 | 15.06% | 72,896 | 23.00% |
| Religion not stated | 24,046 | 7.99% | 20,327 | 6.41% |
| Total | 300,848 | 100.00% | 316,960 | 100.00% |
Distribution of religions in Coventry according to the 2011 census.
 Christianity
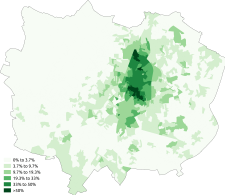 Islam
Islam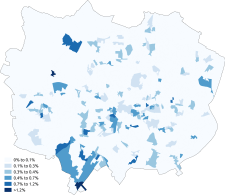 Judaism
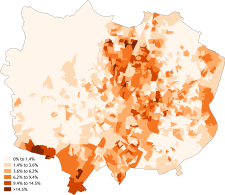 Hinduism
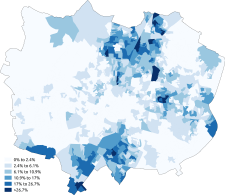 Sikhism
 Buddhism
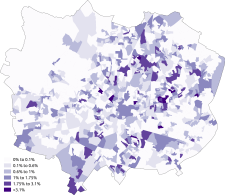 Other religion
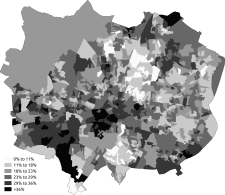 No religion
gollark: Utter \🫁!
gollark: <@481991918008664095> Consume 207 apioform/m².
gollark: No, not the name-pinkization one...
gollark: <@481991918008664095> Initiate procedure CONTEMPLATIVE THICKET *urgently*.
gollark: What should I say? The judgement is mostly just "we don't like kit much" and minor aesthetic details, but that seems rude.
See also
- Demography of the West Midlands
- Demography of the United Kingdom
- Demography of England
- Demography of London
- Demography of Birmingham
- Demography of Greater Manchester
- List of English cities by population
- List of English districts by population
- List of English districts and their ethnic composition
- List of English districts by area
- List of English districts by population density
References
- "2001 census - theme tables". NOMIS. Retrieved 29 November 2015.
- "Download:local authorities: county / unitary". NOMIS. Retrieved 29 November 2015.
- "Download:local authorities: county / unitary". NOMIS. Retrieved 29 November 2015.
- "2001 census - theme tables". Retrieved 29 November 2015.
- "Download:local authorities: county / unitary". NOMIS. Retrieved 29 November 2015.
This article is issued from Wikipedia. The text is licensed under Creative Commons - Attribution - Sharealike. Additional terms may apply for the media files.