Demographics of Aguascalientes
| Demographics of Aguascalientes | |
|---|---|
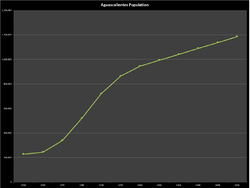
 Population of Aguascalientes from 1950-2010. | |
| Population | 1,184,996 (31 May 2010) |
| Growth rate | 2.2% (2010-2005) |
| Birth rate | 19.0 births/1,000 population (2011) |
| Death rate | 4.3 deaths/1,000 population (2011) |
| Life expectancy | 75.8 years (2011 est.) |
| • male | 73.7 years (2011 est.) |
| • female | 77.9 years (2011 est.) |
| Fertility rate | 2.2 children born/woman (2008 est.) |
| Infant mortality rate | 11.9 deaths/1,000 infants (2011) |
| Net migration rate | 14 migrant(s)/1,000 population |
| Age structure | |
| 0–14 years | 31.6% (male 190,128/female 184,109) |
| 15–64 years | 63.0% (male 357,049/female 389,331) |
| 65 and over | 5.1% (male 27,477/female 32,870) (2010) |
| Nationality | |
| Nationality | noun: Mexican(s) adjective: Mexican |
| Major ethnic | Mexicans (98.7%) |
| Minor ethnic | Americans (0.7%) |
| Language | |
| Official | Spanish |
Age structure 2010
| Age Groups | Total | Male | Female |
|---|---|---|---|
| 0–4 years | 121,557 | 61,941 | 59,616 |
| 5–9 years | 128,874 | 65,572 | 63,302 |
| 10–14 years | 123,806 | 62,615 | 61,191 |
| 15–19 years | 121,428 | 60,636 | 60,792 |
| 20–24 years | 106,305 | 51,431 | 54,874 |
| 25–29 years | 93,604 | 44,568 | 49,036 |
| 30–34 years | 88,726 | 41,962 | 46,764 |
| 35–39 years | 86,254 | 40,569 | 45,685 |
| 40–44 years | 73,084 | 34,381 | 38,703 |
| 45–49 years | 60,198 | 28,420 | 31,778 |
| 50–54 years | 49,980 | 23,436 | 26,544 |
| 55–59 years | 37,543 | 17,960 | 19,583 |
| 60–64 years | 29,258 | 13,686 | 15,572 |
| 65–69 years | 21,004 | 9,895 | 11,109 |
| 70–74 years | 15,254 | 6,967 | 8,287 |
| 75–79 years | 10,673 | 4,862 | 5,811 |
| 80–84 years | 7,228 | 3,094 | 4,134 |
| 85–89 years | 4,061 | 1,780 | 2,281 |
| 90–94 years | 1,467 | 605 | 862 |
| 95–99 years | 551 | 229 | 322 |
| 100 years and over | 109 | 45 | 64 |
| Unspecified | 4,032 |
Historical Data

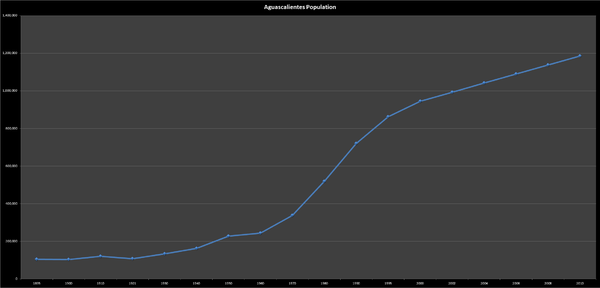
Aguascalientes population 1895-2010.
| Year | Pop. | ±% |
|---|---|---|
| 1895[1] | 104,693 | — |
| 1900 | 102,416 | −2.2% |
| 1910 | 120,511 | +17.7% |
| 1921 | 107,581 | −10.7% |
| 1930 | 132,900 | +23.5% |
| 1940 | 161,693 | +21.7% |
| 1950 | 226,965 | +40.4% |
| 1960 | 243,363 | +7.2% |
| 1970 | 338,142 | +38.9% |
| 1980 | 519,439 | +53.6% |
| 1990 | 719,659 | +38.5% |
| 1995 | 862,720 | +19.9% |
| 2000 | 944,285 | +9.5% |
| 2001 | 968,551 | +2.6% |
| 2002 | 992,751 | +2.5% |
| 2003 | 1,016,950 | +2.4% |
| 2004 | 1,041,150 | +2.4% |
| 2005 | 1,065,416 | +2.3% |
| 2006 | 1,089,319 | +2.2% |
| 2007 | 1,113,222 | +2.2% |
| 2008 | 1,137,125 | +2.1% |
| 2009 | 1,161,093 | +2.1% |
| 2010[2] | 1,184,996 | +2.1% |
Vital statistics
| Year | Population | Live births | Deaths | Natural change |
|---|---|---|---|---|
| 1995 | 862,720 | 25,870 | 3,491 | 22,379 |
| 1996 | 879,024 | 25,115 | 3,498 | 21,617 |
| 1997 | 895,373 | 24,717 | 3,782 | 20,935 |
| 1998 | 911,677 | 25,537 | 3,783 | 21,754 |
| 1999 | 927,981 | 25,424 | 3,917 | 21,507 |
| 2000 | 944,285 | 24,941 | 3,728 | 21,213 |
| 2001 | 968,551 | 27,695 | 3,826 | 23,869 |
| 2002 | 992,751 | 27,524 | 4,301 | 23,223 |
| 2003 | 1,016,950 | 26,165 | 4,293 | 21,872 |
| 2004 | 1,041,150 | 26,527 | 4,488 | 22,039 |
| 2005 | 1,065,416 | 25,619 | 4,431 | 21,188 |
| 2006 | 1,089,319 | 20,946 | 4,488 | 20,946 |
| 2007 | 1,113,222 | 25,822 | 4,694 | 21,128 |
| 2008 | 1,137,125 | 26,509 | 4,955 | 21,554 |
Religion
In 2010, The religious demographics of Aguascalientes were:
- Evangelical Protestant – 40,987
- Roman Catholic – 1,101,785
- Jewish – 113
- Different from Evangelical Bibles – 10,779
- Unclaimed – 21,235
- Others – 722
- Unspecified – 9,375
gollark: Genius!
gollark: My cooler idea was to have an SQLite database and a folder of attachments somewhere.
gollark: I see. How unwebscale.
gollark: Anyway, what zettelkastenous ideas did you have?
gollark: I know MANY languages, but I dislike them all in different ways.
See also
- Mexico
- States of Mexico
- Geography of Mexico
- List of Mexican states by area
- Ranked list of Mexican states
- List of Mexican states by HDI
References
- "Archived copy". Archived from the original on 2012-03-11. Retrieved 2011-07-29.CS1 maint: archived copy as title (link)
- "Archived copy". Archived from the original on 2011-11-27. Retrieved 2012-12-31.CS1 maint: archived copy as title (link)
- "Censo de Población y Vivienda 2010". INEGI. Retrieved 2013-02-03.
Template
This article is issued from Wikipedia. The text is licensed under Creative Commons - Attribution - Sharealike. Additional terms may apply for the media files.