Cooling curve
A cooling curve is a line graph that represents the change of phase of matter, typically from a gas to a solid or a liquid to a solid. The independent variable (X-axis) is time and the dependent variable (Y-axis) is temperature.[1] Below is an example of a cooling curve used in castings.
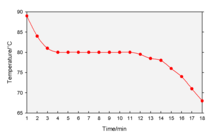
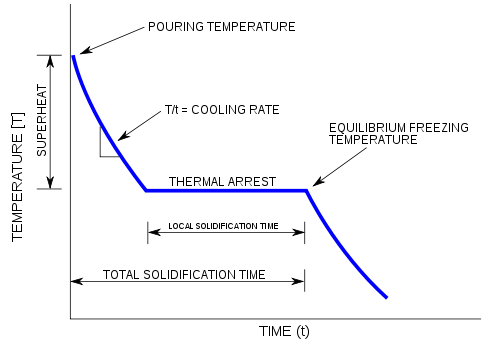
The initial point of the graph is the starting temperature of the matter, here noted as the "pouring temperature". When the phase change occurs there is a "thermal arrest", that is the temperature stays constant. This is because the matter has more internal energy as a liquid or gas than in the state that it is cooling to. The amount of energy required for a phase change is known as latent heat. The "cooling rate" is the slope of the cooling curve at any point.
References
- Garland, Nibler, and Shoemaker. Experiments in Physical Chemistry (7th ed.)
| State |  | |
|---|---|---|
| Low energy | ||
| High energy | ||
| Other states | ||
| Transitions |
| |
| Quantities | ||
| Concepts |
| |