Brigg (UK Parliament constituency)
Brigg was a county constituency centred on the town of Brigg in North Lincolnshire. It returned one Member of Parliament (MP) to the House of Commons of the Parliament of the United Kingdom, elected by the first-past-the-post voting system.
| Brigg | |
|---|---|
| Former County constituency for the House of Commons | |
| County | Lincolnshire (the area is now in North Lincolnshire) |
| 1885–1974 | |
| Number of members | One |
| Replaced by | Brigg & Scunthorpe |
| Created from | North Lincolnshire |
The constituency was created for the 1885 general election, and abolished for the February 1974 general election when it was replaced by the new constituency of Brigg and Scunthorpe.
Boundaries
1885–1918: The Borough of Great Grimsby, the Sessional Divisions of Barton-upon-Humber, Brigg, and Winterton, and part of the Sessional Division of Grimsby.
1918–1950: The Urban Districts of Barton-upon-Humber, Brigg, Broughton, Brumby and Frodingham, Roxby-cum-Risby, Scunthorpe, and Winterton, and the Rural District of Glanford Brigg.
1950–1974: The Borough of Scunthorpe, the Urban Districts of Barton-upon-Humber and Brigg, and the Rural District of Glanford Brigg.
Members of Parliament
| Election | Member | Party | |
|---|---|---|---|
| 1885 | Sir Henry Meysey-Thompson, Bt. | Liberal | |
| 1886 | Liberal Unionist | ||
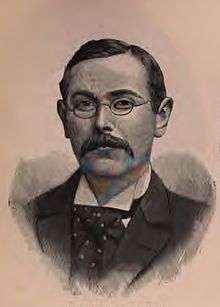
| 1886 | Samuel Danks Waddy | Liberal | |
| 1894 by-election | John Maunsell Richardson | Conservative | |
| 1895 | Harold Reckitt | Liberal | |
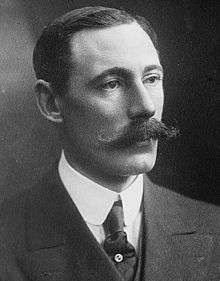
| 1907 by-election | Sir Berkeley Sheffield | Conservative | |
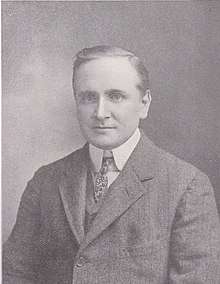
| 1910 (January) | Alfred Gelder | Liberal | |
| 1918 | Charles Wesley Weldon McLean | Coalition Conservative | |
| 1922 | Sir Berkeley Sheffield | Conservative | |
| 1929 | David Quibell | Labour | |
| 1931 | Michael John Hunter | Conservative | |
| 1935 | David Quibell | Labour | |
| 1945 | Tom Williamson | Labour | |
| 1948 by-election | Lance Mallalieu | Labour | |
| February 1974 | constituency abolished: see Brigg and Scunthorpe | ||
Elections
Elections in the 1880s
| Party | Candidate | Votes | % | ± | |
|---|---|---|---|---|---|
| Liberal | Henry Meysey-Thompson | 5,643 | 65.2 | N/A | |
| Conservative | Henry Atkinson | 3,006 | 34.8 | N/A | |
| Majority | 2,637 | 30.4 | N/A | ||
| Turnout | 8,649 | 83.8 | N/A | ||
| Registered electors | 10,323 | ||||
| Liberal win (new seat) | |||||
.jpg)
| Party | Candidate | Votes | % | ± | |
|---|---|---|---|---|---|
| Liberal | Samuel Danks Waddy | 3,887 | 51.1 | −14.1 | |
| Conservative | John Maunsell Richardson | 3,722 | 48.9 | +14.1 | |
| Majority | 165 | 2.2 | −28.2 | ||
| Turnout | 7,609 | 73.7 | -10.1 | ||
| Registered electors | 10,323 | ||||
| Liberal hold | Swing | −14.1 | |||
Elections in the 1890s
| Party | Candidate | Votes | % | ± | |
|---|---|---|---|---|---|
| Liberal | Samuel Danks Waddy | 4,448 | 52.5 | +1.4 | |
| Conservative | John Maunsell Richardson | 4,021 | 47.5 | −1.4 | |
| Majority | 427 | 5.0 | +2.8 | ||
| Turnout | 8,469 | 81.9 | +8.2 | ||
| Registered electors | 10,341 | ||||
| Liberal hold | Swing | +1.4 | |||

| Party | Candidate | Votes | % | ± | |
|---|---|---|---|---|---|
| Conservative | John Maunsell Richardson | 4,377 | 50.4 | +2.9 | |
| Liberal | Harold Reckitt | 4,300 | 49.6 | −2.9 | |
| Majority | 77 | 0.9 | N/A | ||
| Turnout | 8,677 | 82.8 | +0.9 | ||
| Registered electors | 10,478 | ||||
| Conservative gain from Liberal | Swing | +2.9 | |||
| Party | Candidate | Votes | % | ± | |
|---|---|---|---|---|---|
| Liberal | Harold Reckitt | 4,886 | 54.3 | +1.8 | |
| Conservative | John Maunsell Richardson | 4,110 | 45.7 | −1.8 | |
| Majority | 776 | 8.6 | +3.6 | ||
| Turnout | 8,996 | 77.2 | −4.7 | ||
| Registered electors | 11,656 | ||||
| Liberal hold | Swing | +1.8 | |||
Elections in the 1900s
| Party | Candidate | Votes | % | ± | |
|---|---|---|---|---|---|
| Liberal | Harold Reckitt | 4,899 | 54.6 | +0.3 | |
| Conservative | George Herbert Peake | 4,077 | 45.4 | −0.3 | |
| Majority | 822 | 9.2 | +0.6 | ||
| Turnout | 8,976 | 83.8 | +6.6 | ||
| Registered electors | 10,713 | ||||
| Liberal hold | Swing | +0.3 | |||
| Party | Candidate | Votes | % | ± | |
|---|---|---|---|---|---|
| Liberal | Harold Reckitt | 5,753 | 58.8 | +4.2 | |
| Conservative | Geoffrey Henry Julian Skeffington Smyth | 4,027 | 41.2 | −4.2 | |
| Majority | 1,726 | 17.6 | +8.4 | ||
| Turnout | 9,780 | 83.3 | −0.5 | ||
| Registered electors | 11,737 | ||||
| Liberal hold | Swing | +4.2 | |||

| Party | Candidate | Votes | % | ± | |
|---|---|---|---|---|---|
| Conservative | Berkeley Sheffield | 5,389 | 50.5 | +9.3 | |
| Liberal | Frederick Guest | 5,273 | 49.5 | −9.3 | |
| Majority | 116 | 1.0 | N/A | ||
| Turnout | 10,662 | 89.5 | +6.2 | ||
| Registered electors | 11,908 | ||||
| Conservative hold | Swing | +9.3 | |||
Elections in the 1910s

| Party | Candidate | Votes | % | ± | |
|---|---|---|---|---|---|
| Liberal | Alfred Gelder | 6,548 | 50.9 | −7.9 | |
| Conservative | Berkeley Sheffield | 6,311 | 49.1 | +7.9 | |
| Majority | 237 | 1.8 | −15.8 | ||
| Turnout | 12,859 | 91.5 | +8.2 | ||
| Registered electors | 14,048 | ||||
| Liberal hold | Swing | −7.9 | |||

| Party | Candidate | Votes | % | ± | |
|---|---|---|---|---|---|
| Liberal | Alfred Gelder | 6,506 | 53.6 | +2.7 | |
| Conservative | Thomas Jewell Bennett | 5,637 | 46.4 | −2.7 | |
| Majority | 869 | 7.2 | +5.4 | ||
| Turnout | 12,143 | 86.4 | −5.1 | ||
| Registered electors | 14,048 | ||||
| Liberal hold | Swing | +2.7 | |||
General Election 1914/15:
Another General Election was required to take place before the end of 1915. The political parties had been making preparations for an election to take place and by the July 1914, the following candidates had been selected;
- Liberal: Alfred Gelder
- Unionist: Thomas Jewell Bennett
| Party | Candidate | Votes | % | ± | |
|---|---|---|---|---|---|
| C | Unionist | Charles Wesley Weldon McLean | 8,310 | 47.2 | +0.8 |
| Labour | David Quibell | 4,789 | 27.3 | N/A | |
| Liberal | Alfred Gelder | 4,475 | 25.5 | −28.1 | |
| Majority | 3,521 | 19.9 | N/A | ||
| Turnout | 17,574 | 60.5 | −25.9 | ||
| Registered electors | 29,054 | ||||
| Unionist gain from Liberal | Swing | ||||
| C indicates candidate endorsed by the coalition government. | |||||
Elections in the 1920s
| Party | Candidate | Votes | % | ± | |
|---|---|---|---|---|---|
| Unionist | Berkeley Sheffield | 15,463 | 62.7 | +15.5 | |
| Labour | David Quibell | 9,185 | 37.3 | +10.0 | |
| Majority | 6,278 | 25.4 | +5.5 | ||
| Turnout | 24,648 | 80.3 | +19.8 | ||
| Registered electors | 30,685 | ||||
| Unionist hold | Swing | +2.8 | |||
| Party | Candidate | Votes | % | ± | |
|---|---|---|---|---|---|
| Unionist | Berkeley Sheffield | 12,412 | 53.6 | −9.1 | |
| Labour | David Quibell | 10,753 | 46.4 | +9.1 | |
| Majority | 1,659 | 7.2 | −18.2 | ||
| Turnout | 23,165 | 72.8 | −7.5 | ||
| Registered electors | 31,818 | ||||
| Unionist hold | Swing | −9.1 | |||
| Party | Candidate | Votes | % | ± | |
|---|---|---|---|---|---|
| Unionist | Berkeley Sheffield | 15,125 | 56.4 | +2.8 | |
| Labour | David Quibell | 11,669 | 43.6 | −2.8 | |
| Majority | 3,456 | 12.8 | +5.6 | ||
| Turnout | 26,794 | 80.9 | +8.1 | ||
| Registered electors | 33,124 | ||||
| Unionist hold | Swing | +2.8 | |||
| Party | Candidate | Votes | % | ± | |
|---|---|---|---|---|---|
| Labour | David Quibell | 16,117 | 45.2 | +1.6 | |
| Unionist | Berkeley Sheffield | 12,506 | 35.0 | −21.4 | |
| Liberal | Alexander Cairns | 7,060 | 19.8 | N/A | |
| Majority | 3,611 | 10.2 | N/A | ||
| Turnout | 35,683 | 82.5 | +1.6 | ||
| Registered electors | 43,226 | ||||
| Labour gain from Unionist | Swing | +11.5 | |||
Elections in the 1930s
| Party | Candidate | Votes | % | ± | |
|---|---|---|---|---|---|
| Conservative | Michael John Hunter | 21,809 | 58.3 | +23.3 | |
| Labour | David Quibell | 15,614 | 41.7 | −3.5 | |
| Majority | 6,195 | 16.6 | N/A | ||
| Turnout | 37,423 | 82.1 | −0.4 | ||
| Registered electors | 45,565 | ||||
| Conservative gain from Labour | Swing | +13.4 | |||
| Party | Candidate | Votes | % | ± | |
|---|---|---|---|---|---|
| Labour | David Quibell | 18,495 | 50.3 | +8.6 | |
| Conservative | Michael John Hunter | 18,292 | 49.7 | −8.6 | |
| Majority | 203 | 0.6 | N/A | ||
| Turnout | 36,787 | 74.2 | −7.9 | ||
| Registered electors | 49,597 | ||||
| Labour gain from Conservative | Swing | +8.6 | |||
Elections in the 1940s
| Party | Candidate | Votes | % | ± | |
|---|---|---|---|---|---|
| Labour | Tom Williamson | 26,771 | 58.92 | +8.6 | |
| Conservative | Anthony Neville Dixon | 18,667 | 41.08 | -8.6 | |
| Majority | 8,104 | 17.84 | +17.2 | ||
| Turnout | 45,438 | 74.61 | +0.4 | ||
| Labour hold | Swing | +8.6 | |||
| Party | Candidate | Votes | % | ± | |
|---|---|---|---|---|---|
| Labour | Edward Lancelot Mallalieu | 27,333 | 54.58 | -4.34 | |
| Conservative | Anthony Fell | 22,746 | 45.42 | +4.34 | |
| Majority | 4,587 | 9.16 | -8.68 | ||
| Turnout | 50,079 | 77.1 | +0.5 | ||
| Labour hold | Swing | −4.3 | |||
Elections in the 1950s
| Party | Candidate | Votes | % | ± | |
|---|---|---|---|---|---|
| Labour | Lance Mallalieu | 28,934 | 52.71 | -6.21 | |
| Conservative | Meaburn Francis Staniland | 18,521 | 33.74 | -7.34 | |
| Liberal | Denis Martin Cowley | 7,438 | 13.55 | N/A | |
| Majority | 10,413 | 18.97 | +1.13 | ||
| Turnout | 54,893 | 85.7 | +8.6 | ||
| Labour hold | Swing | ||||
| Party | Candidate | Votes | % | ± | |
|---|---|---|---|---|---|
| Labour | Lance Mallalieu | 31,151 | 57.46 | +4.76 | |
| Conservative | Charles P Lawson | 23,062 | 42.54 | +8.84 | |
| Majority | 8,089 | 14.92 | -4.08 | ||
| Turnout | 54,213 | 82.42 | -3.28 | ||
| Registered electors | 65,775 | ||||
| Labour hold | Swing | -2.04 | |||
| Party | Candidate | Votes | % | ± | |
|---|---|---|---|---|---|
| Labour | Lance Mallalieu | 27,847 | 54.95 | -2.51 | |
| Conservative | David S B Hopkins | 22,826 | 45.05 | +2.51 | |
| Majority | 5,021 | 9.91 | -5.01 | ||
| Turnout | 50,673 | 74.73 | -7.69 | ||
| Registered electors | 67,808 | ||||
| Labour hold | Swing | -2.51 | |||
| Party | Candidate | Votes | % | ± | |
|---|---|---|---|---|---|
| Labour | Lance Mallalieu | 28,997 | 51.88 | -3.07 | |
| Conservative | Roland Croft Baker | 26,893 | 48.12 | +3.07 | |
| Majority | 2,104 | 3.76 | -6.15 | ||
| Turnout | 55,890 | 78.57 | +3.84 | ||
| Registered electors | 71,138 | ||||
| Labour hold | Swing | -3.07 | |||
Elections in the 1960s
| Party | Candidate | Votes | % | ± | |
|---|---|---|---|---|---|
| Labour | Lance Mallalieu | 29,480 | 49.76 | -2.12 | |
| Conservative | Roland Croft Baker | 22,674 | 38.27 | -9.95 | |
| Liberal | Keith W Baynes | 7,088 | 11.96 | N/A | |
| Majority | 6,806 | 11.49 | +7.73 | ||
| Turnout | 59,242 | 77.52 | -1.05 | ||
| Registered electors | 76,420 | ||||
| Labour hold | Swing | +3.92 | |||
| Party | Candidate | Votes | % | ± | |
|---|---|---|---|---|---|
| Labour | Lance Mallalieu | 33,699 | 60.08 | +10.32 | |
| Conservative | Ann Spokes | 22,391 | 39.92 | +1.65 | |
| Majority | 11,308 | 20.16 | +8.67 | ||
| Turnout | 56,090 | 72.39 | -5.13 | ||
| Registered electors | 77,484 | ||||
| Labour hold | Swing | +4.34 | |||
Elections in the 1970s
| Party | Candidate | Votes | % | ± | |
|---|---|---|---|---|---|
| Labour | Lance Mallalieu | 31,434 | 53.38 | -6.70 | |
| Conservative | Ann Spokes | 27,449 | 46.62 | +6.70 | |
| Majority | 3,985 | 6.77 | -13.39 | ||
| Turnout | 58,883 | 67.55 | -4.84 | ||
| Registered electors | 87,166 | ||||
| Labour hold | Swing | -6.70 | |||
See also
References
- Craig, FWS, ed. (1974). British Parliamentary Election Results: 1885-1918. London: Macmillan Press. p. 337. ISBN 9781349022984.
- "The Brigg Election". The Daily News. 10 December 1894. p. 3.
- Craig, F.W.S., ed. (1969). British parliamentary election results 1918-1949. Glasgow: Political Reference Publications. p. 417. ISBN 0-900178-01-9.
- Kimber, Richard. "UK General Election results February 1950". Political Science Resources. Archived from the original on 8 March 2017. Retrieved 10 April 2016.
- The Times' Guide to the House of Commons. 1950.
- Kimber, Richard. "UK General Election results 1951". Political Science Resources. Archived from the original on 29 June 2017. Retrieved 10 April 2016.
- Kimber, Richard. "UK General Election results 1955". Political Science Resources. Archived from the original on 26 March 2016. Retrieved 10 April 2016.
- Kimber, Richard. "UK General Election results 1959". Political Science Resources. Archived from the original on 29 June 2017. Retrieved 10 April 2016.
- Kimber, Richard. "UK General Election results 1964". Political Science Resources. Archived from the original on 29 June 2017. Retrieved 10 April 2016.
- Kimber, Richard. "UK General Election results 1966". Political Science Resources. Archived from the original on 24 September 2015. Retrieved 10 April 2016.
- Kimber, Richard. "UK General Election results 1970". Political Science Resources. Archived from the original on 3 March 2016. Retrieved 10 April 2016.