Bihiya
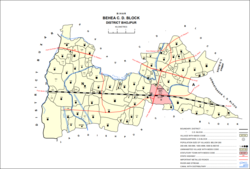
Behea or Bihiya is a nagar panchayat town in Bhojpur district in the Indian state of Bihar, as well as an associated sub-district. The sub-district comprises 76 rural villages, along with the town of Bihiya itself and 22 uninhabited villages. As of 2011, the population of the sub-district was 151,722, of whom 26,707 lived in the town of Bihiya itself. [1]
Behea Bihiya | |
|---|---|
town | |
 Location in Behea block | |
 Behea Location in Bihar, India  Behea Behea (India) | |
| Coordinates: 25.5607°N 84.45935°E | |
| Country | |
| State | Bihar |
| District | Bhojpur |
| Area | |
| • Total | 100 km2 (40 sq mi) |
| Population (2011) | |
| • Total | 26,707[1] |
| Languages | |
| • Official | Bhojpuri, Hindi |
| Time zone | UTC+5:30 (IST) |
| PIN | 802152 |
| Sex ratio | 58-42 ♂/♀ |
| Website | bhojpur |
History
A branch of the Harihoban Rajputs once ruled Bihiya. According to tradition, in 1528[2], the scion of the Bihiya Harihobans, whose name is given as either Ram Pal Singh[2] or Bhopat Deo[1], raped a local Brahmin woman named Mathin or Mahini, in line with the custom of "taking of dola", which allowed the local Rajput lord to sleep with a lower-caste woman on her wedding night.[2] Mathin then committed suicide, but not before laying a curse upon the Harihobans, who eventually left Bihiya and moved to Ballia across the Ganges.[1] A temple called the Mathin Dai was built in Bihiya in her memory. This legend still resonates with women of the region, especially Dalit women, as it encapsulates the sexual violence long perpetrated by upper-caste men against lower-caste women.[2]
When The Imperial Gazetteer of India was published in 1885, it mentioned the existence of Bihiya as a village of Shahabad district, with a station on the East Indian Railway. Bihiya was mentioned as being a center of local trade. A Bihiya Canal was also described, branching off from the Arrah Canal.[3]
Bihiya was first listed as a nagar panchayat town in the 1980s.[1]
Demographics
| Year | Pop. | ±% |
|---|---|---|
| 1971 | 8,253 | — |
| 1981 | 11,602 | +40.6% |
| 1991 | 17,082 | +47.2% |
| 2001 | 20,741 | +21.4% |
| 2011 | 26,707 | +28.8% |
| Source: 2011 Census of India[1] | ||
As of the 2001 census,[4] the population was approximately 25,000, of which 17% were below age 6. The population was primarily a mix of Hindus and Muslims, and the primary spoken language was Bhojpuri. 59% of the population was reported to be literate, including 41% among females.
The population of Bihiya sub-district in 2001 was 139,374; this increased to 151,722 by 2011. Likewise, the population of the town of Bihiya itself increased by 28.8%, from 20,741 in 2001 to 26,707 in 2011. The district overall had a sex ratio of 918 in 2011 (917 in rural areas, and 920 in the town of Bihiya itself). In the 0-6 age group, the ratio was higher: 923 in rural areas, 964 in the town of Bihiya, and 928 overall. Members of scheduled castes formed 16.65% of the sub-district's total population, and 9.09% of the population of the town of Bihiya. Likewise, members of scheduled tribes constituted 1.39% of the total population of the sub-district, and 3.21% of the population of the town of Bihiya. The 3.21% of scheduled tribe members in the town of Bihiya was the highest percentage of towns in Bhojpur district in 2011. The literacy rate of the sub-district as a whole was 67.8% in 2011 (69.4% in rural areas, and 78.2% in the town of Bihiya itself).[1]
25.66% of the population of Bihiya sub-district, and 24.31% of the population of the town of Bihiya, was engaged in main or marginal work in 2011; both figures were the lowest in Bhojpur district for sub-districts and towns respectively. A plurality of workers in Bihiya sub-district were agricultural laborers who did not own or rent their own land (instead, they work on another person's land for wages), accounting for 40.79% of the workforce. Cultivators who did own or lease their own land constituted 25.05% of the sub-district's workforce, household industry workers were 4.10%, and other workers were the remaining 29.24%. These figures were all fairly close to the average for the entire district of Bhojpur. Patterns of employment were different in the town of Bihiya, where both categories of agricultural workers combined formed less than 20% of the workforce. Other workers were 70.49%, compared to the 72.55% average for all towns in Bhojpur.[1]
Transport
Behea is served by a railway station and bus stop.
Culture
Important festivals are Holi, Diwali, Durgapuja, Chhath Puja, Id-ul-Fitar and Muharram.
Food
Traditional breakfast foods are jalebi and puri (handmade puri), and many other sweets are available. Litti Chokha is widely available.
Temples
The Mahthin Mai temple is located, which is famous for marriages, A beautiful Sun temple with a beautiful lake is located in the middle of the town. The temple compound hosts a number of fairs. Other temples in Behea include the Sun Temple, Mahavir Mandir and Durga Mata Mandir
Economy
The main occupations are agriculture and commerce. Behea is in a fertile agricultural area where the main crops are wheat and rice.[5] Farmers are independent land owners who raise their own cattle and crops. A small number of Zamindars (landlords) rent their farms to others. The main water source for irrigation is a tributary of the Ganga river.
Of the total land area in Bihiya sub-district, 71.92% is under cultivation; of the cultivated area, 63.91% is irrigated.[1]
Small-scale industries include an asbestos factory and brick-making.
Behea is a business hub for small-scale traders, who mainly collect agricultural products from farmers to sell elsewhere. Power shortages constrict Behea's economic potential.
The commercial district is the Raja Bazaar on Station Road, which includes shopping complexes such as the Jagdamba Market. Jewelry shops dominate the district.
According to the 2011 Census of India, the main three commodities manufactured in the town of Bihiya are bamboo products, brooms, and biscuits.[1]
Education
+2 High School, Behea, Mahathin Maa College, H D College Bihiya, Girija Devi Polytechnic College, Gautam public school, Jawahar Navodaya Vidyalaya, Don Bosco Academy, Cambridge Public School, Gyanodaya, Gurukul Gyan Niketan, Vivekanand public school and many more educational institutions are present.
Villages
Apart from the town of Bihiya itself, the sub-district of Bihiya comprises the following 98 villages, of which 76 are inhabited and 22 are uninhabited:[1]
| Village name | Total land area (hectares) | Population (in 2011) |
|---|---|---|
| Amiya | 46 | 804 |
| Amrai | 342 | 2,033 |
| Andar | 219 | 1,790 |
| Andauli | 50 | 253 |
| Bagahin | 96 | 4,653 |
| Banahin | 348 | 1,841 |
| Bandha | 79 | 2,287 |
| Bankat | 22 | 0 (uninhabited) |
| Bankat | 171 | 3,077 |
| Bara | 153 | 1,938 |
| Baruna | 130 | 1,035 |
| Basdeopur | 122 | 1,103 |
| Bela | 39 | 732 |
| Belauna | 76 | 1,249 |
| Bharsanda Jado | 87 | 3,163 |
| Bharsanda Mangit | 104 | 1,310 |
| Bhinriya | 111 | 1,249 |
| Bhoja Chak | 43 | 316 |
| Bibi Mah Chak | 42 | 281 |
| Bikrampur | 26 | 0 (uninhabited) |
| Bikrampur | 145 | 936 |
| Birpur | 136 | 2,785 |
| Chakwath | 482 | 4,964 |
| Chaughara | 57 | 133 |
| Dalpatpur | 40 | 960 |
| Dariwan | 102 | 0 (uninhabited) |
| Dhanikara | 28 | 0 (uninhabited) |
| Dharhara | 50 | 881 |
| Doghra | 253 | 4,108 |
| Dubauli | 28 | 224 |
| Dusadhi Chak | 39 | 0 (uninhabited) |
| English Pur | 50 | 900 |
| Gajrar | 130 | 785 |
| Garhatha | 53 | 0 (uninhabited) |
| Gaudar Chak Tal | 45 | 60 |
| Gaudar Rudar Nagar | 208 | 5,015 |
| Ghagha | 70 | 2,126 |
| Hirdepur | 89 | 294 |
| Itwa | 108 | 2,207 |
| Jadopur | 278 | 2,923 |
| Jamua | 176 | 2,308 |
| Jogibir | 197 | 1,661 |
| Kaleyanpur | 269 | 5,923 |
| Kamriaon | 251 | 4,259 |
| Kanela | 34 | 841 |
| Kaneli | 126 | 1,815 |
| Kanhai Geyan Sinh | 131 | 0 (uninhabited) |
| Karkhiyan | 106 | 1,168 |
| Katea | 582 | 6,329 |
| Kauriya | 191 | 2,208 |
| Kawalpura | 60 | 0 (uninhabited) |
| Kewal Patti | 129 | 1,023 |
| Khakhu Bandh | 202 | 426 |
| Kharauni | 153 | 1,373 |
| Kuardah | 114 | 907 |
| Kundesar | 362 | 3,141 |
| Mahuaon | 291 | 3,093 |
| Makhdumpur | 89 | 946 |
| Maniara | 206 | 1,565 |
| Marinpur | 141 | 1,317 |
| Marwatia | 86 | 0 (uninhabited) |
| Maujhali | 171 | 3,162 |
| Meha Chak | 110 | 71 |
| Misrauli | 53 | 1,222 |
| Mohanpur | 27 | 0 (uninhabited) |
| Moti Rampur | 27 | 875 |
| Nainagarha | 35 | 0 (uninhabited) |
| Narayanpur | 32 | 1,297 |
| Narayanpur | 46 | 546 |
| Nausha Tanr | 87 | 1,019 |
| Nawada | 199 | 2,058 |
| Nawadih | 113 | 1,059 |
| Osain | 480 | 6,308 |
| Pahari Pipra | 32 | 0 (uninhabited) |
| Parariya | 40 | 0 (uninhabited) |
| Patkhaulia | 36 | 0 (uninhabited) |
| Phingi | 152 | 2,557 |
| Phulai | 65 | 955 |
| Pipra Jagdis | 115 | 2,830 |
| Rajaur | 309 | 0 (uninhabited) |
| Ramdatahi | 18 | 321 |
| Ramdubwal | 74 | 0 (uninhabited) |
| Rampur | 40 | 520 |
| Rani Sagar | 113 | 7,711 |
| Rati Dubawal | 61 | 0 (uninhabited) |
| Rustampur | 48 | 0 (uninhabited) |
| Sahjauli | 180 | 1,473 |
| Saho Dih | 191 | 1,673 |
| Samardah | 103 | 2,282 |
| Sharaur | 183 | 2,175 |
| Shiupur | 217 | 2,653 |
| Sikariya | 352 | 2,843 |
| Sirampur | 19 | 0 (uninhabited) |
| Sukhari Chak | 41 | 0 (uninhabited) |
| Sukrauli | 67 | 0 (uninhabited) |
| Teghra | 130 | 3,049 |
| Tetariya | 99 | 907 |
| Tiar | 841 | 4,338 |
| Tikhpur | 156 | 0 (uninhabited) |
References
- "Census of India 2011: Bihar District Census Handbook - Bhojpur, Part A (Village and Town Directory)". Census 2011 India. pp. 42, 46–47, 51–55, 59–61, 63, 71–84, 90, 92, 94, 752, 808–809. Retrieved 1 April 2020.
- Kalyan Mukherjee (1979). "Peasant Revolt in Bhojpur". Economic and Political Weekly. 14 (36): 1536–1538. JSTOR 4367921.
- Hunter, William Wilson (1885). The Imperial Gazetteer of India, Volume II: Balasor to Biramganta (Second ed.). London: Trübner & Co. p. 422. Retrieved 6 April 2020.
- "Census of India 2001: Data from the 2001 Census, including cities, villages and towns (Provisional)". Census Commission of India. Archived from the original on 16 June 2004. Retrieved 1 November 2008.
- "Bihar". farmech.dac.gov.in. Retrieved 22 December 2019.