A Chart of Biography
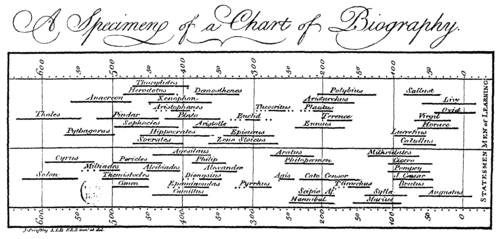
In 1765, 18th-century British polymath Joseph Priestley published A Chart of Biography and its accompanying prose description as a supplement to his Lectures on History and General Policy.[1] Priestley believed that the chart and A New Chart of History (1769) would allow students to "trace out distinctly the dependence of events to distribute them into such periods and divisions as shall lay the whole claim of past transactions in a just and orderly manner."[2]

The Chart of Biography covers a vast timespan, from 1200 BC to 1800 AD, and includes two thousand names. Priestley organized his list into six categories: Statesman and Warriors; Divines and Metaphysicians; Mathematicians and Physicians (natural philosophers were placed here); Poets and Artists; Orators and Critics (prose fiction authors were placed here); and Historians and Antiquarians (lawyers were placed here). Priestley's "principle of selection" was fame, not merit; therefore, as he mentions, the chart is a reflection of current opinion. He also wanted to ensure that his readers would recognize the entires on the chart. Priestley had difficulty assigning all of the people listed to individual categories; he attempted to list them in the category under which their most important work had been done. Machiavelli is therefore listed as a historian rather than a statesman and Cicero is listed as a statesman instead of an orator. The chart was also arranged in order of importance; "statesmen are placed on the lower margin, where they are easier to see, because they are the names most familiar to readers."[3][4]
Both Charts were popular for decades—the A New Chart of History went through fifteen editions by 1816.[5] The trustees of Warrington were so impressed with Priestley's lectures and charts that they arranged for the University of Edinburgh to grant him a Doctor of Law degree in 1764.[6]
Notes
- Priestley, Joseph. A Chart of Biography. London: J. Johnson, St. Paul's Church Yard, 1765 and Joseph Priestley, A description of a chart of biography. [Warrington] : Printed at Warrington, 1764; A Description of a Chart of Biography. Warrington: Printed by William Eyres, 1765.
- Qtd. in Sheps, 141-2.
- Sheps, 144.
- McLachlan, 253; Sheps, 142-5.
- Gibbs, 37.
- Schofield, 118-9.
Bibliography
- McLachlan, John. "Joseph Priestley and the Study of History." Transactions of the Unitarian Historical Society 19 (1987–90): 252-63.
- Schofield, Robert E. The Enlightenment of Joseph Priestley: A Study of his Life and Work from 1733 to 1773. University Park: Pennsylvania State University Press, 1997. ISBN 0-271-01662-0.
- Sheps, Arthur (1999). "Joseph Priestley's Time Charts: The Use and Teaching of History by Rational Dissent in late Eighteenth-Century England" (PDF). Lumen: Selected Proceedings from the Canadian Society for Eighteenth-Century Studies. available from Érudit. 18: 135–154. doi:10.7202/1012372ar.
