2015 Portsmouth City Council election
The 2015 Portsmouth City Council election took place on 7 May 2015 to elect members of Portsmouth City Council in England.[1] This was on the same day as other local elections.
| |||||||||||||||||||||||||||||
14 of the 42 seats to Portsmouth City Council 23 seats needed for a majority | |||||||||||||||||||||||||||||
|---|---|---|---|---|---|---|---|---|---|---|---|---|---|---|---|---|---|---|---|---|---|---|---|---|---|---|---|---|---|
| |||||||||||||||||||||||||||||
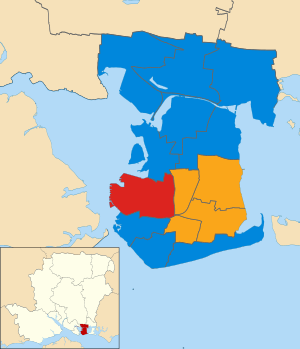 Map of 2015 results | |||||||||||||||||||||||||||||
| |||||||||||||||||||||||||||||
Election Results
| Party | Seats | Gains | Losses | Net gain/loss | Seats % | Votes % | Votes | +/− | |
|---|---|---|---|---|---|---|---|---|---|
| Conservative | 9 | 5 | 0 | 64.3 | 34.3% | 30,193 | |||
| Liberal Democrats | 4 | 0 | 5 | 28.6 | 19.7% | 17,342 | |||
| Labour | 1 | 1 | 1 | 7.1 | 19.4% | 17,060 | |||
| UKIP | 0 | 0 | 0 | 0 | 0 | 16.7% | 14,734 | ||
| Green | 0 | 0 | 0 | 0 | 0 | 8.4 | 7,426 | ||
| TUSC | 0 | 0 | 0 | 0 | 0 | 1.1 | 1,003 | ||
| Independent | 0 | 0 | 0 | 0 | 0 | 0.3% | 285 | ||
Change in composition
After the 2015 local election, the political make up of the council was as follows:[3] These seats were then next contested in 2019.
| Party | Number of councillors |
|---|---|
| Labour | 4 |
| Conservative | 19 |
| Liberal Democrats | 14 |
| UKIP | 4 |
| Green | 0 |
| Independent | 1 |
Results by Ward
Comparisons for the purpose of determining a gain, hold or loss of a seat, and for all percentage changes, is to the last time these specific seats were up for election in 2011. A "*" indicates that that councillor was re-elected.
| Party | Candidate | Votes | % | ± | |
|---|---|---|---|---|---|
| Liberal Democrats | Lynne Stagg* | 2,198 | 30% | ||
| Conservative | George Edgar | 2,044 | 28% | ||
| UKIP | Matt Ainsworth | 1,580 | 22% | ||
| Labour | Michelle Treacher | 1,061 | 15% | ||
| Green | Sarah Coote | 379 | 5% | ||
| Trade Unionists and Socialists Against Cuts | Wendy Hamm | 55 | <1% | ||
| Majority | 154 | 2% | |||
| Turnout | 7,317 | 63.9 | +24.7 | ||
| Liberal Democrats hold | Swing | ||||
| Party | Candidate | Votes | % | ± | |
|---|---|---|---|---|---|
| Liberal Democrats | Suzy Horton | 2,026 | 31% | ||
| Conservative | Kevin Warne | 1,424 | 22% | ||
| Green | Ian David McCulloch | 1384 | 21% | ||
| Labour | Benjamin Perry | 1,064 | 16% | ||
| UKIP | Derek William Arthur Wareham | 623 | 9% | ||
| Trade Unionists and Socialists Against Cuts | Daniel Sutton-Johanson | 82 | 1% | ||
| Majority | 602 | 9% | |||
| Turnout | 6603 | ||||
| Liberal Democrats hold | Swing | ||||
| Party | Candidate | Votes | % | ± | |
|---|---|---|---|---|---|
| Labour | Yahiya Chowdhury | 1,373 | 26% | ||
| Liberal Democrats | Jacqui Hancock | 1,361 | 25% | ||
| UKIP | Carl Edward John Paddon | 1,200 | 22% | ||
| Conservative | Christopher John Hirst | 987 | 18% | ||
| Green | Hannah Mary Dawson | 367 | 7% | ||
| Trade Unionists and Socialists Against Cuts | Chris Pickett | 88 | 2% | ||
| Majority | 602 | 9% | |||
| Turnout | 5376 | ||||
| Labour gain from Liberal Democrats | Swing | ||||
| Party | Candidate | Votes | % | ± | |
|---|---|---|---|---|---|
| Conservative | Kevin Warne | 2,732 | 42% | ||
| UKIP | Terry Chipperfield-Harrison | 1484 | 23% | ||
| Labour | Terry King | 1,428 | 22% | ||
| Liberal Democrats | Alan John Webb | 446 | 7% | ||
| Green | Mark William Townsin | 315 | 5% | ||
| Trade Unionists and Socialists Against Cuts | Daniel Sutton-Johanson | 70 | 1% | ||
| Majority | 602 | 9% | |||
| Turnout | 1248 | ||||
| Conservative hold | Swing | ||||
| Party | Candidate | Votes | % | ± | |
|---|---|---|---|---|---|
| Conservative | Lee Michael Chris John Mason | 2,768 | 42% | ||
| Labour | Graham Philip Heaney | 1,525 | 23% | ||
| UKIP | Mike Jerome | 1,381 | 21% | ||
| Liberal Democrats | Kirstine McDowell Impey | 466 | 7% | ||
| Green | Ash Potter | 318 | 5% | ||
| Trade Unionists and Socialists Against Cuts | Adi Graham | 90 | 1% | ||
| Majority | 602 | 9% | |||
| Turnout | 6548 | ||||
| Conservative hold | Swing | ||||
| Party | Candidate | Votes | % | ± | |
|---|---|---|---|---|---|
| Conservative | Ken Ellcome | 4,953 | 66% | ||
| Labour | Andreas Bubel | 1,347 | 18% | ||
| Green | Gavin Mark Ellis | 538 | 7% | ||
| Liberal Democrats | Tom Wood | 524 | 7% | ||
| Trade Unionists and Socialists Against Cuts | Simon Wade | 150 | 2% | ||
| Majority | |||||
| Turnout | 7512 | ||||
| Conservative hold | Swing | ||||
| Party | Candidate | Votes | % | ± | |
|---|---|---|---|---|---|
| Conservative | Jennie Brent | 2,574 | 40% | ||
| Liberal Democrats | Paul Frank Pritchard | 1,500 | 23% | ||
| UKIP | Garth Peter Leonard Hessey | 890 | 14% | ||
| Labour | Julian Paul Wright | 805 | 12% | ||
| Green | Katie Jane Worsfold | 646 | 10% | ||
| Trade Unionists and Socialists Against Cuts | Paul John Smith | 60 | 1% | ||
| Majority | |||||
| Turnout | 6475 | 64.2 | |||
| Conservative gain from Liberal Democrats | Swing | ||||
| Party | Candidate | Votes | % | ± | |
|---|---|---|---|---|---|
| Liberal Democrats | Dave Ashmore | 1,497 | 26% | ||
| UKIP | Paul Daniel Lovegrove | 1,194 | 21% | ||
| Labour | Sue Castillon | 1,127 | 20% | ||
| Conservative | Massoud Esmaili | 1,122 | 22% | ||
| Green | Martin Peter Cox | 3408 | 7% | ||
| Independent | Mike Hancock | 285 | 5% | ||
| Trade Unionists and Socialists Against Cuts | John Paul Pickett | 74 | 1% | ||
| Majority | |||||
| Turnout | 5707 | ||||
| Liberal Democrats hold | Swing | ||||
| Party | Candidate | Votes | % | ± | |
|---|---|---|---|---|---|
| Conservative | Scott Robert Harris | 2,829 | 43% | ||
| Labour | Sue Greenfield | 1,547 | 24% | ||
| UKIP | Kevan Chippindall-Higgin | 1,311 | 20% | ||
| Liberal Democrats | Joshua Dulberg | 437 | 7% | ||
| Green | Abbie Eales | 329 | 5% | ||
| Trade Unionists and Socialists Against Cuts | Doug Willis | 54 | 1% | ||
| Majority | |||||
| Turnout | 6,507 | ||||
| Conservative hold | Swing | ||||
| Party | Candidate | Votes | % | ± | |
|---|---|---|---|---|---|
| Liberal Democrats | Gerald Vernon-Jackson | 2,291 | 34% | ||
| Conservative | Stuart John Crow | 1,728 | 25% | ||
| UKIP | Robbie Robinson | 1,018 | 15% | ||
| Labour | Alex Bentley | 948 | 14% | ||
| Green | Jay Dunstan | 763 | 11% | ||
| Trade Unionists and Socialists Against Cuts | Sean Hoyle | 57 | 1% | ||
| Majority | |||||
| Turnout | 6,507 | ||||
| Liberal Democrats hold | Swing | ||||
| Party | Candidate | Votes | % | ± | |
|---|---|---|---|---|---|
| Conservative | Ian Colin Sinclair Lyon | 1,360 | 25% | ||
| UKIP | Barry Paul Davies | 1,347 | 24% | ||
| Labour | Rob Smith | 1,298 | 23% | ||
| Liberal Democrats | Leo Madden | 1,221 | 22% | ||
| Green | Bianca Barbara Vermeulen-Smith | 249 | 4% | ||
| Trade Unionists and Socialists Against Cuts | Nicholas John Doyle | 65 | 1% | ||
| Majority | |||||
| Turnout | 6,507 | ||||
| Conservative gain from Liberal Democrats | Swing | ||||
| Party | Candidate | Votes | % | ± | |
|---|---|---|---|---|---|
| Conservative | Gemma Louise New | 1,814 | 33% | ||
| Labour | David Ratcliffe Horne | 1,745 | 32% | ||
| UKIP | David Allen Cox | 1,417 | 26% | ||
| Liberal Democrats | Maria Cole | 258 | 5% | ||
| Green | Phil Dickinson | 243 | 4% | ||
| Trade Unionists and Socialists Against Cuts | Sean Hoyle | 42 | 1% | ||
| Majority | |||||
| Turnout | 6,507 | ||||
| Conservative gain from Labour | Swing | ||||
gollark: It gets JITed. Did you not know?
gollark: Compilers did that, not people, probably.
gollark: I'm actually always correct so yes.
gollark: Premature optimisation is bad, so avoid spending ages for dubiously useful speed gains. But really inefficient code in some contexts is also bad, so optimise tight loops, frequently called stuff and real time stuff.
gollark: <@331320482047721472> h?
References
- "Upcoming elections & referendums". The Electoral Commission. Archived from the original on 15 March 2015. Retrieved 1 April 2015.
- http://www.andrewteale.me.uk/leap/results/2015/90/
- Portsmouth City Council
- "Election results for Baffins". Portsmouth.gov.uk. 8 May 2015. Retrieved 27 April 2019.
- "Central Southsea". Portsmouth.gov.uk. 8 May 2015. Retrieved 27 April 2019.
- "Election results for Charles Dickens". Portsmouth.gov.uk. 8 May 2015. Retrieved 27 April 2019.
- "Election results for Copnor". Portsmouth.gov.uk. 8 May 2015. Retrieved 27 April 2019.
- "Election results for Cosham". Portsmouth.gov.uk. 8 May 2015. Retrieved 27 April 2019.
- "Election results for Drayton & Farlington". Portsmouth.gov.uk. 8 May 2015. Retrieved 27 April 2019.
- "Election results for Eastney & Craneswater". Portsmouth.gov.uk. 8 May 2015. Retrieved 27 April 2019.
- "EElection results for Fratton". Portsmouth.gov.uk. 8 May 2015. Retrieved 27 April 2019.
- "Election results for Hilsea". Portsmouth.gov.uk. 8 May 2015. Retrieved 27 April 2019.
- "Election results for Hilsea". Portsmouth.gov.uk. 8 May 2015. Retrieved 27 April 2019.
- "Election results for Nelson". Portsmouth.gov.uk. 8 May 2015. Retrieved 27 April 2019.
- "Election results for Paulsgrove". Portsmouth.gov.uk. 8 May 2015. Retrieved 27 April 2019.
| Preceded by 2014 Portsmouth City Council election |
Portsmouth City Council elections | Succeeded by 2016 Portsmouth City Council election |
This article is issued from Wikipedia. The text is licensed under Creative Commons - Attribution - Sharealike. Additional terms may apply for the media files.