2013 Suffolk County Council election
Elections to Suffolk County Council took place on 2 May 2013 as part of the 2013 United Kingdom local elections. 75 councillors were elected from 63 electoral divisions, which returned either one or two county councillors each by first-past-the-post voting for a four-year term of office. The electoral divisions were the same as those used at the previous election in 2009.
| |||||||||||||||||||||||||||||||||||||||||||||||||||||||||||||
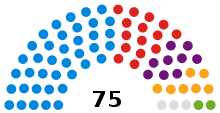
All 75 seats in the Suffolk County Council 38 seats needed for a majority | |||||||||||||||||||||||||||||||||||||||||||||||||||||||||||||
|---|---|---|---|---|---|---|---|---|---|---|---|---|---|---|---|---|---|---|---|---|---|---|---|---|---|---|---|---|---|---|---|---|---|---|---|---|---|---|---|---|---|---|---|---|---|---|---|---|---|---|---|---|---|---|---|---|---|---|---|---|---|
| |||||||||||||||||||||||||||||||||||||||||||||||||||||||||||||
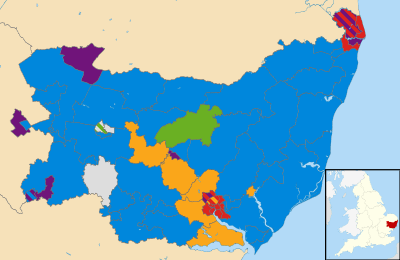 Map of the results of the 2013 Suffolk council election. Conservatives in blue, Liberal Democrats in yellow, Labour in red, Greens in green, independent in grey and UK Independence Party in purple. | |||||||||||||||||||||||||||||||||||||||||||||||||||||||||||||
Labour and the Conservatives were the only parties with candidates standing in all sixty-three electoral divisions.
All locally registered electors (British, Irish, Commonwealth and European Union citizens) who were aged 18 or over on Thursday 2 May 2013 were entitled to vote in the local elections.[1] Those who were temporarily away from their ordinary address (for example, away working, on holiday, in student accommodation or in hospital) were also entitled to vote in the local elections, although those who had moved abroad and registered as overseas electors cannot vote in the local elections. It is possible to register to vote at more than one address (such as a university student who had a term-time address and lives at home during holidays) at the discretion of the local Electoral Register Office, but it remains an offence to vote more than once in the same local government election.[2]
Summary
The Conservative Party won a total of 39 seats, a net loss of sixteen, retaining a reduced overall majority of three seats. The Labour Party regained their position as the largest opposition party, making a net gain of 11 seats. The UK Independence Party also made gains, winning nine seats on the County Council. The Liberal Democrats lost seats to the Conservatives and to Labour, winning the same number of seats as they won in 2005, seven. Three independent candidates were elected, while the Green Party retained their two seats.
Results across the county were far from uniform. In the Suffolk Coastal district area, the Conservatives held their own, and in the Babergh district they actually made a net gain of 1 seat (Hadleigh) from the Liberal Democrats.
Mid Suffolk saw just one seat (Stowmarket South) change hands by a single vote, with UKIP gaining from the Conservatives. The Conservatives also made a net loss of two seats in St Edmundsbury after losing two seats to UKIP in Haverhill and one to an Independent in Bury St Edmunds, but then regained Hardwick from the Liberal Democrats. In other districts, however, the Conservatives lost significant ground. In Ipswich, they were reduced to a sole representative in the town after losing 4 seats and thus reversing the gains they had made in the 2009 election. After almost wiping the board in 2009, the party also suffered major losses in Waveney with 7 seats transferring to Labour and UKIP. A further two divisions switched from Conservative to UKIP in Forest Heath.
Labour made a strong recovery in Ipswich, with the party almost completely recovering from its heavy losses in the town in 2009 and returned to the Council with its best cohort since 2005 taking 10 of the 13 seats. The party also made a modest recovery in the Waveney area with a further 5 gains from the Conservatives. This though, was still 4 seats short of the 9 seats they secured in 2005. In other areas of the county, the Labour recovery failed to gain traction. They won no seats in Haverhill, Bury St Edmunds and Sudbury, which all had Labour councillors until 2009.
The Liberal Democrats made losses in three of the four seats where their incumbent councillors were not seeking re-election but held the seven seats where they had sitting councillors.
The Green Party retained its two seats with increased majorities in each, but were unable to add to their tally.
Independent councillors Richard Kemp and Trevor Beckwith retained their seats, and were joined by David Nettleton, who gained one of the Tower seats in Bury St Edmunds from the Conservatives.
Government Formation
With 39 seats and a third successive victory, the Conservatives were able to form a working majority of 3 in the new Council, with Cllr Mark Bee (Beccles) elected as Council Leader. Cllr Mark Bee retired as Leader in May 2015 and returned to the back benches. He was subsequently replaced by Cllr Colin Noble (Row Heath), who narrowly defeated rival Cllr Jenny Antill (Cosford) in the ensuing leadership election.
The Conservatives' majority was cut to 1 in May 2016 with the loss of Haverhill Cangle to UKIP. Four months later, Hadleigh was gained by the Liberal Democrats in a further by-election and the Conservatives lost their overall majority although continued to run the Council as a minority administration for the remainder of its term.
Overall Result
| Party | Seats | Gains | Losses | Net gain/loss | Seats % | Votes % | Votes | +/− | |
|---|---|---|---|---|---|---|---|---|---|
| Conservative | 39 | 2 | 18 | 52.0 | 36.1 | 79,357 | |||
| Labour | 15 | 11 | 0 | 20.0 | 24.6 | 54,061 | |||
| UKIP | 9 | 8 | 0 | 12.0 | 18.4 | 40,447 | |||
| Liberal Democrats | 7 | 0 | 4 | 9.3 | 10.1 | 22,176 | |||
| Independent | 3 | 1 | 0 | 4.0 | 3.0 | 6,495 | |||
| Green | 2 | 0 | 0 | 2.7 | 8.0 | 17,549 | |||
Detailed results
| Party | Candidate | Votes | % | ± | |
|---|---|---|---|---|---|
| Conservative | Richard Smith | 1,031 | 39.6 | -7.9 | |
| Independent | Tony Cooper | 703 | 27.0 | +27.0 | |
| Labour | Terry Hodgson | 433 | 16.6 | +3.5 | |
| Green | Marie Clark | 250 | 9.6 | -5.3 | |
| Liberal Democrats | Paul Jackman-Graham | 188 | 7.2 | -17.3 | |
| Majority | 328 | 12.6 | -10.4 | ||
| Turnout | 35.0 | ||||
| Conservative hold | Swing | -17.5 | |||
| Party | Candidate | Votes | % | ± | |
|---|---|---|---|---|---|
| Conservative | Mark Bee | 1,822 | 21.6 | -1.6 | |
| Conservative | Chris Punt | 1,449 | 17.1 | -3.3 | |
| Green | Graham Elliott | 1,322 | 15.6 | ||
| Labour | Barry Buckley | 973 | 11.5 | +3.0 | |
| Green | Sue Bergin | 918 | 10.9 | ||
| Labour | Stuart Foulger | 868 | 10.3 | +2.2 | |
| UKIP | Harry Ashbee | 856 | 10.1 | ||
| Liberal Democrats | Alison Briggs | 135 | 1.6 | ||
| Liberal Democrats | Doug Farmer | 111 | 1.3 | ||
| Majority | 127 | 1.5 | -2.0 | ||
| Turnout | 37.7 | ||||
| Conservative hold | Swing | ||||
| Conservative hold | Swing | ||||
| Party | Candidate | Votes | % | ± | |
|---|---|---|---|---|---|
| Liberal Democrats | David Busby | 692 | 37.5 | -12.4 | |
| Conservative | Peter Burgoyne | 617 | 33.5 | -6.6 | |
| Labour | David Plowman | 332 | 18.0 | +8.1 | |
| Green | Terry Hooley | 203 | 11.0 | ||
| Majority | 75 | 4.1 | -5.8 | ||
| Turnout | 27.7 | ||||
| Liberal Democrats hold | Swing | ||||
| Party | Candidate | Votes | % | ± | |
|---|---|---|---|---|---|
| Conservative | Alan Murray | 1,146 | 58.4 | -3.3 | |
| Labour | Lewis Smith | 485 | 24.7 | +11.1 | |
| Green | Catherine Struthers | 222 | 11.3 | -2.7 | |
| Liberal Democrats | Peter Bagnall | 109 | 5.6 | -11.7 | |
| Majority | 661 | 33.7 | +4.1 | ||
| Turnout | 34.7 | ||||
| Conservative hold | Swing | ||||
| Party | Candidate | Votes | % | ± | |
|---|---|---|---|---|---|
| Conservative | Joanna Spicer | 1,565 | 53.2 | -5.6 | |
| UKIP | Chas Coles | 892 | 30.3 | ||
| Labour | James MacPherson | 247 | 8.4 | +2.1 | |
| Liberal Democrats | David Bradbury | 121 | 4.1 | ||
| Green | Richard Braybrooke | 118 | 4.0 | ||
| Majority | 673 | 22.9 | -14.6 | ||
| Turnout | 37.1 | ||||
| Conservative hold | Swing | ||||
| Party | Candidate | Votes | % | ± | |
|---|---|---|---|---|---|
| Conservative | Michael Gower | 1,191 | 47.8 | +5.5 | |
| Labour Co-op | Anne Thomas | 483 | 19.4 | +12.6 | |
| Liberal Democrats | Marian Andrews | 426 | 17.1 | ||
| Green | Joe Cassels | 391 | 15.7 | ||
| Majority | 708 | 28.4 | +19.0 | ||
| Turnout | |||||
| Conservative hold | Swing | ||||
| Party | Candidate | Votes | % | ± | |
|---|---|---|---|---|---|
| Liberal Democrats | Julia Truelove | 851 | 33.9 | -6.9 | |
| Conservative | Esther Jewson | 678 | 27.0 | -0.0 | |
| UKIP | Sam Streatfeild | 584 | 23.2 | +9.2 | |
| Labour | Tony Elliott | 236 | 9.4 | +4.7 | |
| Green | Tricia Aspinall | 160 | 6.3 | ||
| Majority | 173 | 6.9 | -6.9 | ||
| Turnout | |||||
| Liberal Democrats hold | Swing | ||||
| Party | Candidate | Votes | % | ± | |
|---|---|---|---|---|---|
| UKIP | Reg Silvester | 995 | 45.9 | +15.8 | |
| Conservative | Stephen Edwards | 593 | 27.3 | -25.5 | |
| Liberal Democrats | Ian Horner | 344 | 15.8 | ||
| Labour | Tom Caple | 235 | 10.8 | +3.1 | |
| Majority | 402 | 18.6 | -4.2 | ||
| Turnout | |||||
| UKIP gain from Conservative | Swing | ||||
| Party | Candidate | Votes | % | ± | |
|---|---|---|---|---|---|
| Labour Co-op | Bryony Rudkin | 743 | 43.9 | +11.7 | |
| UKIP | Alan Cotterell | 459 | 27.1 | ||
| Conservative | Bob Hall | 338 | 20.0 | -11.5 | |
| Green | Eric Nelson | 83 | 4.9 | ||
| Liberal Democrats | Philip Green | 71 | 4.2 | ||
| Majority | 284 | 16.8 | +16.1 | ||
| Turnout | |||||
| Labour Co-op hold | Swing | ||||
| Party | Candidate | Votes | % | ± | |
|---|---|---|---|---|---|
| Conservative | David Ritchie | 1,150 | 45.2 | -4.4 | |
| Green | Simon Thompson | 756 | 29.7 | ||
| Labour | Declan Keiley | 440 | 17.3 | +3.7 | |
| Liberal Democrats | Dave O`Neill | 197 | 7.8 | ||
| Majority | 394 | 15.5 | -12.6 | ||
| Turnout | |||||
| Conservative hold | Swing | ||||
| Party | Candidate | Votes | % | ± | |
|---|---|---|---|---|---|
| Conservative | Peter Bellfield | 1,565 | 59.0 | -7.3 | |
| UKIP | Leon Stedman | 504 | 19.0 | ||
| Labour Co-op | Edna Salmon | 374 | 14.1 | +6.9 | |
| Liberal Democrats | Victor Harrup | 208 | 7.9 | ||
| Majority | 1,061 | 40.0 | +0.1 | ||
| Turnout | |||||
| Conservative hold | Swing | ||||
| Party | Candidate | Votes | % | ± | |
|---|---|---|---|---|---|
| Labour | Helen Armitage | 2,169 | 25.7 | +6.5 | |
| Labour | Peter Gardiner | 2,051 | 24.3 | +6.0 | |
| UKIP | Robert Newton | 1,301 | 15.4 | ||
| Conservative | Nadia Cenci | 1,096 | 13.0 | ||
| Conservative | Kevin Algar | 1,043 | 12.3 | ||
| Green | Barry Broom | 404 | 4.8 | ||
| Liberal Democrats | Julie Fletcher | 243 | 2.9 | ||
| Liberal Democrats | Stuart McHardy | 146 | 1.7 | ||
| Majority | 750 | ||||
| Turnout | |||||
| Labour hold | Swing | ||||
| Labour gain from Conservative | Swing | ||||
| Party | Candidate | Votes | % | ± | |
|---|---|---|---|---|---|
| Conservative | Mary Evans | 1,579 | 46.3 | -9.5 | |
| UKIP | Stuart Letten | 1,077 | 31.6 | +9.0 | |
| Labour | Gary Stroud | 434 | 12.7 | +5.0 | |
| Independent | Tony Gearing | 323 | 9.5 | ||
| Majority | 502 | 14.7 | -18.5 | ||
| Turnout | |||||
| Conservative hold | Swing | ||||
| Party | Candidate | Votes | % | ± | |
|---|---|---|---|---|---|
| Conservative | Jenny Antill | 1,450 | 51.9 | -12.6 | |
| Green | Robert Lindsay | 1,128 | 40.4 | ||
| Labour Co-op | Tony Bavington | 217 | 7.8 | -0.6 | |
| Majority | 322 | 11.5 | -25.8 | ||
| Turnout | |||||
| Conservative hold | Swing | ||||
| Party | Candidate | Votes | % | ± | |
|---|---|---|---|---|---|
| Independent | Trevor Beckwith | 860 | 39.8 | -7.7 | |
| Conservative | Peter Thompson | 674 | 31.2 | -6.3 | |
| UKIP | Mark Jones | 307 | 14.2 | ||
| Labour | Jonathan Hartley | 254 | 11.7 | +5.4 | |
| Liberal Democrats | Mark Valladares | 68 | 3.1 | ||
| Majority | 186 | 8.6 | -1.3 | ||
| Turnout | |||||
| Independent hold | Swing | ||||
| Party | Candidate | Votes | % | ± | |
|---|---|---|---|---|---|
| UKIP | David Hudson | 720 | 30.7 | +10.1 | |
| Conservative | Bill Sadler | 587 | 25.0 | -13.7 | |
| Labour | Michael Jefferys | 471 | 20.1 | +8.1 | |
| Independent | Simon Cole | 445 | 19.0 | 8.1 | |
| Liberal Democrats | Ian Radford | 123 | 5.2 | ||
| Majority | 133 | 5.7 | -4.4 | ||
| Turnout | |||||
| UKIP gain from Conservative | Swing | 11.9 | |||
| Party | Candidate | Votes | % | ± | |
|---|---|---|---|---|---|
| Conservative | Nick Barber | 2,626 | 27.84 | +2.5 | |
| Conservative | Graham Newman | 2,487 | 26.36 | +2.4 | |
| Labour | Hattie Bennett | 1294 | 13.72 | +7.5 | |
| Labour | Brenda Shelley | 1142 | 12.11 | +6.3 | |
| Liberal Democrats | Seamus Bennett | 985 | 10.44 | ||
| Liberal Democrats | Cherrie MacGregor | 900 | 9.54 | ||
| Majority | 1193 | ||||
| Turnout | |||||
| Conservative hold | Swing | ||||
| Conservative hold | Swing | ||||
| Party | Candidate | Votes | % | ± | |
|---|---|---|---|---|---|
| Conservative | John Goodwin | 1,112 | 44.95 | +1.6 | |
| Labour | David Rowe | 918 | 37.11 | +7.4 | |
| Liberal Democrats | Michael Nimmey | 444 | 17.95 | ||
| Majority | 194 | 7.8 | -5.8 | ||
| Turnout | |||||
| Conservative hold | Swing | ||||
| Party | Candidate | Votes | % | ± | |
|---|---|---|---|---|---|
| Conservative | Stephen Burroughes | 1,126 | 44.26 | -9.7 | |
| UKIP | David Owen | 582 | 22.88 | ||
| Labour | Lesley Bensley | 358 | 14.07 | +6.3 | |
| Green | Rachel Fulcher | 256 | 10.06 | ||
| Liberal Democrats | Andrew Houseley | 222 | 8.73 | ||
| Majority | 544 | 21.4 | -13.1 | ||
| Turnout | |||||
| Conservative hold | Swing | ||||
| Party | Candidate | Votes | % | ± | |
|---|---|---|---|---|---|
| Labour Co-op | Kim Cook | 1,074 | 47.44 | +8.4 | |
| Conservative | Carol Debman | 547 | 24.16 | ||
| UKIP | Stephen York | 495 | 21.86 | ||
| Liberal Democrats | Robert Chambers | 84 | 3.71 | ||
| Green | Rory JAMES | 64 | 2.83 | ||
| Majority | 527 | 23.3 | +22.4 | ||
| Turnout | |||||
| Labour Co-op gain from Conservative | Swing | ||||
| Party | Candidate | Votes | % | ± | |
|---|---|---|---|---|---|
| Liberal Democrats | John Field | 713 | 32 | -11.6 | |
| Conservative | John Whithead | 577 | 25.9 | ||
| UKIP | Frank Whittle | 537 | 24.1 | ||
| Labour Co-op | Jack Abbott | 301 | 13.51 | +7.9 | |
| Green | David Penny | 100 | 4.49 | ||
| Majority | 136 | 6.1 | -11.7 | ||
| Turnout | |||||
| Liberal Democrats hold | Swing | ||||
| Party | Candidate | Votes | % | ± | |
|---|---|---|---|---|---|
| Conservative | Peter Beer | 728 | 42.95 | -13.4 | |
| Labour | Tom Keane | 536 | 31.62 | +18.5 | |
| Green | Dean Walton | 320 | 18.88 | ||
| Liberal Democrats | Andrew Welsh | 111 | 6.55 | ||
| Majority | 192 | 11.3 | -14.6 | ||
| Turnout | |||||
| Conservative hold | Swing | ||||
| Party | Candidate | Votes | % | ± | |
|---|---|---|---|---|---|
| Labour | Keith Patience | 1,579 | 19.88 | +4.9 | |
| Labour | Janet Craig | 1,570 | 19.76 | +8.4 | |
| Conservative | Mary Rudd | 1055 | 13.28 | ||
| UKIP | Paul Newbery | 1049 | 13.2 | ||
| UKIP | Penny Hackett | 1033 | 13 | ||
| Conservative | Deanna Law | 970 | 12.21 | ||
| Green | Emma Bateman | 279 | 3.51 | ||
| Green | Peter Eyres | 246 | 3.1 | ||
| Liberal Democrats | Steven Taylor | 163 | 2.05 | ||
| Majority | 515 | ||||
| Turnout | |||||
| Labour gain from Conservative | Swing | ||||
| Labour gain from Conservative | Swing | ||||
| Party | Candidate | Votes | % | ± | |
|---|---|---|---|---|---|
| Conservative | Brian Riley | 584 | 31.52 | -8.7 | |
| Liberal Democrats | Trevor Sheldrick | 449 | 24.23 | -20.2 | |
| UKIP | Barry Nutt | 422 | 22.77 | ||
| Labour | Angela Wiltshire | 308 | 16.62 | +1.3 | |
| Green | Michael Fodsike | 90 | 4.86 | ||
| Majority | 135 | 7.3 | +3.1 | ||
| Turnout | |||||
| Conservative gain from Liberal Democrats | Swing | ||||
| Party | Candidate | Votes | % | ± | |
|---|---|---|---|---|---|
| Conservative | Tony Goldson | 1,350 | 53.15 | +1.2 | |
| Labour | Toby Walton | 700 | 27.56 | +13.5 | |
| Green | Jen Berry | 374 | 14.72 | ||
| Liberal Democrats | Janet Blowers O`Neill | 116 | 4.57 | ||
| Majority | 650 | 25.6 | -7.3 | ||
| Turnout | |||||
| Conservative hold | Swing | ||||
| Party | Candidate | Votes | % | ± | |
|---|---|---|---|---|---|
| Conservative | Sarah Stamp | 799 | 30.03 | ||
| Independent | Paul Hopfensperger | 737 | 27.7 | ||
| UKIP | David Hussell | 495 | 18.6 | ||
| Labour | Shirley Stephenson | 325 | 12.21 | +5.9 | |
| Liberal Democrats | Chris Lale | 305 | 11.46 | ||
| Majority | 62 | 2.3 | -6.0 | ||
| Turnout | |||||
| Conservative gain from Liberal Democrats | Swing | ||||
| Party | Candidate | Votes | % | ± | |
|---|---|---|---|---|---|
| Conservative | Jessica Fleming | 1,086 | 43.53 | -11.5 | |
| UKIP | Christopher Streatfield | 553 | 22.16 | ||
| Green | Ghed Paterson | 365 | 14.63 | ||
| Labour | Di McGeever | 362 | 14.51 | +6.7 | |
| Liberal Democrats | David Payne | 129 | 5.17 | ||
| Majority | 533 | 21.4 | -9.4 | ||
| Turnout | |||||
| Conservative hold | Swing | ||||
| Party | Candidate | Votes | % | ± | |
|---|---|---|---|---|---|
| Conservative | Anne Gower | 1,269 | 22.48 | -3.2 | |
| UKIP | Julian Flood | 1098 | 19.45 | ||
| Labour | Maureen Byrne | 1082 | 19.16 | +8.3 | |
| Conservative | Karen Richardson | 1082 | 19.16 | ||
| Labour | Pat Hanlon | 876 | 15.52 | +5.6 | |
| Liberal Democrats | Mick Graham | 239 | 4.23 | ||
| Majority | 16 | ||||
| Turnout | |||||
| Conservative hold | Swing | ||||
| UKIP gain from Conservative | Swing | ||||
| Party | Candidate | Votes | % | ± | |
|---|---|---|---|---|---|
| UKIP | Tony Brown | 788 | 39.15 | ||
| Conservative | Alaric Pugh | 504 | 25.04 | -32.6 | |
| Labour | Roger André | 431 | 21.41 | +5.6 | |
| Liberal Democrats | Ken Rolph | 235 | 11.67 | ||
| Independent | Gordon Cox | 55 | 2.73 | ||
| Majority | 284 | 14.1 | -16.9 | ||
| Turnout | |||||
| UKIP gain from Conservative | Swing | ||||
| Party | Candidate | Votes | % | ± | |
|---|---|---|---|---|---|
| Conservative | Guy McGregor | 1,238 | 45.58 | -11.2 | |
| UKIP | Paul Denham | 666 | 24.52 | ||
| Labour Co-op | Garry Deeks | 447 | 16.46 | +9.5 | |
| Green | Libbi Meade | 227 | 8.36 | ||
| Liberal Democrats | Jon James | 138 | 5.08 | ||
| Majority | 572 | 21.1 | +0.5 | ||
| Turnout | |||||
| Conservative hold | Swing | ||||
| Party | Candidate | Votes | % | ± | |
|---|---|---|---|---|---|
| Conservative | Robert Whiting | 1,968 | 25.6 | -3.6 | |
| Conservative | Christopher Hudson | 1,729 | 22.49 | -6.5 | |
| UKIP | Frederick Rapsey | 1369 | 17.8 | ||
| Labour | Kevin Archer | 973 | 12.65 | +5.5 | |
| Labour | Matthew Percy | 770 | 10.01 | +4.4 | |
| Liberal Democrats | Stephanie Fairbrother | 481 | 6.26 | ||
| Liberal Democrats | Derrick Fairbrother | 399 | 5.19 | ||
| Majority | 360 | ||||
| Turnout | |||||
| Conservative hold | Swing | ||||
| Conservative hold | Swing | ||||
| Party | Candidate | Votes | % | ± | |
|---|---|---|---|---|---|
| Conservative | Michael Ladd | 1,027 | 37.61 | -4.4 | |
| UKIP | Jack Tyler | 859 | 31.45 | +4.0 | |
| Labour | Alan Green | 592 | 21.68 | ||
| Green | Emma Waller | 179 | 6.55 | ||
| Liberal Democrats | John Marsden | 74 | 2.71 | ||
| Majority | 168 | 6.2 | -8.4 | ||
| Turnout | |||||
| Conservative hold | Swing | ||||
| Party | Candidate | Votes | % | ± | |
|---|---|---|---|---|---|
| UKIP | Derek Hackett | 1,410 | 18.18 | +2.0 | |
| UKIP | Bill Mountford | 1,406 | 18.13 | ||
| Labour | Ian Graham | 1338 | 17.25 | +4.8 | |
| Labour | Nick Webb | 1326 | 17.09 | +7.4 | |
| Conservative | Trish Mortimer | 798 | 10.29 | -4.4 | |
| Conservative | May Reader | 710 | 9.15 | -4.3 | |
| Green | Tom Hammond | 211 | 2.72 | ||
| Liberal Democrats | Brian Howe | 210 | 2.71 | ||
| Liberal Democrats | Sandra Tonge | 178 | 2.29 | ||
| Green | Steven Nichols | 170 | 2.19 | ||
| Majority | 68 | 0.9 | -0.4 | ||
| Turnout | |||||
| UKIP gain from Conservative | Swing | ||||
| UKIP hold | Swing | ||||
| Party | Candidate | Votes | % | ± | |
|---|---|---|---|---|---|
| Conservative | Patricia O'Brien | 1,600 | 50.47 | +2.1 | |
| Liberal Democrats | John Kelso | 709 | 22.37 | ||
| Labour | Andrew Cortson | 456 | 14.38 | +8.7 | |
| Green | Betsy Reid | 405 | 12.78 | ||
| Majority | 891 | 28.1 | +14.0 | ||
| Turnout | |||||
| Conservative hold | Swing | ||||
| Party | Candidate | Votes | % | ± | |
|---|---|---|---|---|---|
| Independent | Richard Kemp | 1,387 | 53.18 | -14.8 | |
| UKIP | Dave Reynolds | 478 | 18.33 | ||
| Conservative | Sarah Pugh | 421 | 16.14 | -9.9 | |
| Labour Co-op | Mick Cornish | 176 | 6.75 | +8.7 | |
| Green | Graham Manning | 146 | 5.6 | ||
| Majority | 909 | 34.9 | -7.1 | ||
| Turnout | |||||
| Independent hold | Swing | ||||
| Party | Candidate | Votes | % | ± | |
|---|---|---|---|---|---|
| Conservative | James Waters | 893 | 39.27 | -4.6 | |
| UKIP | David Chandler | 884 | 38.87 | +9.1 | |
| Labour | Patrick Finn | 316 | 13.9 | +2.0 | |
| Liberal Democrats | John Ssmith | 7.96 | |||
| Majority | 9 | 0.4 | -13.7 | ||
| Turnout | |||||
| Conservative hold | Swing | ||||
| Party | Candidate | Votes | % | ± | |
|---|---|---|---|---|---|
| Conservative | Lisa Chambers | 968 | 44.63 | -2.8 | |
| UKIP | Dave Whitelear | 615 | 28.35 | +10.8 | |
| Labour | Chris Turner | 450 | 20.75 | +11.8 | |
| Liberal Democrats | Tim Huggan | 136 | 6.27 | ||
| Majority | 353 | 16.3 | -5.2 | ||
| Turnout | |||||
| Conservative hold | Swing | ||||
| Party | Candidate | Votes | % | ± | |
|---|---|---|---|---|---|
| UKIP | Bert Poole | 1,650 | 19.88 | +6.9 | |
| Labour | Leonard Jacklin | 1540 | 18.56 | +7.6 | |
| Conservative | Mike Barnard | 1475 | 17.78 | -1.4 | |
| Labour | Susan Collins | 1428 | 17.21 | +6.4 | |
| Conservative | Colin Law | 1379 | 16.62 | +1.0 | |
| Green | Maxine Narburgh | 378 | 4.56 | ||
| Green | John Nixon | 228 | 2.75 | ||
| Liberal Democrats | Michelle Lavill | 220 | 2.65 | ||
| Majority | 65 | ||||
| Turnout | |||||
| UKIP gain from Conservative | Swing | ||||
| Labour gain from Conservative | Swing | ||||
| Party | Candidate | Votes | % | ± | |
|---|---|---|---|---|---|
| Labour | Sonia Barker | 1,214 | 17.47 | ||
| Labour | Peter Byatt | 1,194 | 17.18 | ||
| UKIP | Jamie Brown | 1095 | 15.76 | ||
| UKIP | Darius McCormack | 1018 | 14.65 | ||
| Conservative | Kathy Gosling | 1012 | 14.56 | ||
| Conservative | Frank Mortimer | 992 | 14.28 | ||
| Green | George Langley | 165 | 2.37 | ||
| Green | Douglas Hoffman | 138 | 1.99 | ||
| Liberal Democrats | Adam Robertson | 121 | 1.74 | ||
| Majority | 99 | ||||
| Turnout | |||||
| Labour gain from Conservative | Swing | ||||
| Labour gain from Conservative | Swing | ||||
| Party | Candidate | Votes | % | ± | |
|---|---|---|---|---|---|
| Liberal Democrats | David Wood | 1,122 | 43.12 | -13.4 | |
| UKIP | Christopher Streatfield | 532 | 20.45 | ||
| Conservative | Sian Dawson | 530 | 20.37 | ||
| Labour | Keith Rawlings | 257 | 9.88 | ||
| Green | Andrew Sterling | 161 | 6.19 | ||
| Majority | 590 | 22.7 | +2.1 | ||
| Turnout | 32.5 | ||||
| Liberal Democrats hold | Swing | ||||
| Party | Candidate | Votes | % | ± | |
|---|---|---|---|---|---|
| Labour | Bill Quinton | 829 | 52.97 | +10.6 | |
| UKIP | Michael Chelk | 325 | 20.77 | ||
| Conservative | Mark Felix-Thomas | 271 | 17.32 | ||
| Green | Fraser Florence | 73 | 4.66 | ||
| Liberal Democrats | Mathew BAKER | 67 | 4.28 | ||
| Majority | 504 | 32.2 | +2.1 | ||
| Turnout | 24.8 | ||||
| Labour hold | Swing | ||||
| Party | Candidate | Votes | % | ± | |
|---|---|---|---|---|---|
| Conservative | Colin Noble | 1,104 | 43.43 | -9.1 | |
| UKIP | Ian Smith | 881 | 34.66 | ||
| Independent | David Gathercole | 284 | 11.17 | ||
| Labour | Pamela Brown | 197 | 7.75 | ||
| Liberal Democrats | Elle Minshall | 76 | 2.99 | ||
| Majority | 223 | 8.8 | -13.6 | ||
| Turnout | 32.6 | ||||
| Conservative hold | Swing | ||||
| Party | Candidate | Votes | % | ± | |
|---|---|---|---|---|---|
| Labour | Sandra Gage | 1,117 | 47.25 | +21.75 | |
| Conservative | Judy Terry | 628 | 26.57 | -16.83 | |
| UKIP | Peter Ellis | 401 | 16.96 | ||
| Green | Kirsty Wilmot | 94 | 3.98 | -11.62 | |
| Liberal Democrats | Gareth Jones | 90 | 3.81 | -11.69 | |
| Liberal Democrats | Dale Jackson | 34 | 1.44 | ||
| Majority | 489 | 20.7 | +2.8 | ||
| Turnout | |||||
| Labour gain from Conservative | Swing | ||||
| Party | Candidate | Votes | % | ± | |
|---|---|---|---|---|---|
| Conservative | Gordon Jones | 1,025 | 33.72 | -10.7 | |
| Liberal Democrats | Michael Bamford | 773 | 25.43 | ||
| UKIP | Stephen Laing | 755 | 24.84 | ||
| Labour Co-op | Sue Thomas | 314 | 10.33 | ||
| Green | Lois Hickey | 173 | 5.69 | ||
| Majority | 252 | 8.3 | +3.0 | ||
| Turnout | |||||
| Conservative hold | Swing | ||||
| Party | Candidate | Votes | % | ± | |
|---|---|---|---|---|---|
| Labour | Mandy Gaylard | 900 | 45.55 | ||
| UKIP | Mark Tinney | 361 | 18.27 | ||
| Conservative | Katherine Parkinson | 359 | 18.17 | ||
| Green | Tom Wilmot | 201 | 10.17 | ||
| Liberal Democrats | Timothy Lockington | 155 | 7.84 | ||
| Majority | 539 | 27.3 | +21.8 | ||
| Turnout | 26.0 | ||||
| Labour gain from Liberal Democrats | Swing | ||||
| Party | Candidate | Votes | % | ± | |
|---|---|---|---|---|---|
| Labour Co-op | Sandy Martin | 1,089 | 54.56 | +14.3 | |
| Conservative | Edward Phillips | 562 | 28.16 | -5.9 | |
| Green | Sarah Alexander | 227 | 11.37 | ||
| Liberal Democrats | Robin Whitmore | 118 | 5.91 | ||
| Majority | 527 | 26.4 | +20.2 | ||
| Turnout | 29.7 | ||||
| Labour Co-op hold | Swing | ||||
| Party | Candidate | Votes | % | ± | |
|---|---|---|---|---|---|
| Labour | Sarah Adams | 1,668 | 17.21 | +9.7 | |
| Liberal Democrats | Inga Lockington | 1,457 | 15.03 | ||
| Labour | Rob Bridgeman | 1441 | 14.87 | +7.6 | |
| Conservative | Lee Reynolds | 1355 | 13.98 | ||
| Conservative | Christopher Stewart | 1257 | 12.97 | ||
| Liberal Democrats | Cathy French | 1211 | 12.49 | ||
| UKIP | John Chapman | 823 | 8.49 | ||
| Green | John Mann | 481 | 4.96 | ||
| Majority | 16 | 0.2 | -4.7 | ||
| Turnout | 33.7 | ||||
| Labour gain from Liberal Democrats | Swing | ||||
| Liberal Democrats hold | Swing | ||||
| Party | Candidate | Votes | % | ± | |
|---|---|---|---|---|---|
| Conservative | James Finch | 1,129 | 42.48 | +0.6 | |
| Liberal Democrats | Bryn Hurren | 723 | 27.2 | ||
| UKIP | James Carver | 585 | 22.01 | ||
| Labour | Jack Owen | 221 | 8.31 | +4.9 | |
| Majority | 406 | 15.3 | +13.9 | ||
| Turnout | 43.7 | ||||
| Conservative hold | Swing | ||||
| Party | Candidate | Votes | % | ± | |
|---|---|---|---|---|---|
| Conservative | Gary Green | 830 | 36.13 | -9.9 | |
| UKIP | Colin ay | 586 | 25.51 | ||
| Labour | Duncan Macpherson | 458 | 19.94 | +10.0 | |
| Green | Nigel Rozier | 354 | 15.41 | ||
| Liberal Democrats | Brij Sharma | 69 | 3.0 | ||
| Majority | 244 | 10.6 | +13.1 | ||
| Turnout | 24.9 | ||||
| Conservative hold | Swing | ||||
| Party | Candidate | Votes | % | ± | |
|---|---|---|---|---|---|
| UKIP | Stephen Searle | 578 | 25.6 | +9.5 | |
| Conservative | Anne Whybrow | 577 | 25.55 | -7.05 | |
| Liberal Democrats | Keith Scarff | 538 | 23.83 | -6.07 | |
| Labour | Suzanne Britton | 314 | 13.91 | +4.81 | |
| Green | Linda Baxter | 251 | 11.12 | -1.08 | |
| Majority | 1 | 0.04 | -2.68 | ||
| Turnout | 30.1 | ||||
| UKIP gain from Conservative | Swing | +8.28 | |||
| Party | Candidate | Votes | % | ± | |
|---|---|---|---|---|---|
| Conservative | John Sayers | 809 | 44.28 | -0.4 | |
| Labour | Luke Cresswell | 573 | 31.36 | +9.76 | |
| Liberal Democrats | Tony Platt | 223 | 12.21 | ||
| Green | Teresa Bishop | 222 | 12.15 | ||
| Majority | 236 | 12.9 | +1.9 | ||
| Turnout | 26.5 | ||||
| Conservative hold | Swing | -5.08 | |||
| Party | Candidate | Votes | % | ± | |
|---|---|---|---|---|---|
| Conservative | Colin Spence | 874 | 45.9 | -3.7 | |
| UKIP | Stuart Armstrong | 527 | 27.68 | ||
| Labour Co-op | Russell Smith | 402 | 21.11 | +9.7 | |
| Green | Robert Whiting | 101 | 5.3 | ||
| Majority | 347 | 18.2 | -7.6 | ||
| Turnout | |||||
| Conservative hold | Swing | ||||
| Party | Candidate | Votes | % | ± | |
|---|---|---|---|---|---|
| Conservative | Jane Storey | 1,190 | 47.47 | -5.8 | |
| UKIP | Ryan Fiske | 626 | 24.97 | ||
| Green | Alex Browne | 309 | 12.33 | ||
| Labour | James Grime | 271 | 10.81 | +3.4 | |
| Liberal Democrats | Ann Gath | 111 | 4.43 | ||
| Majority | 564 | 22.5 | -7.4 | ||
| Turnout | |||||
| Conservative hold | Swing | ||||
| Party | Candidate | Votes | % | ± | |
|---|---|---|---|---|---|
| Liberal Democrats | Penny Otton | 722 | 29.18 | ||
| Conservative | Sam Powell | 684 | 27.65 | -8.6 | |
| UKIP | Gillian Bush | 647 | 26.15 | ||
| Green | Ella Copeland | 229 | 9.26 | ||
| Labour | Jeanie Kemp | 192 | 7.76 | +3.4 | |
| Majority | 38 | 1.5 | +0.5 | ||
| Turnout | |||||
| Conservative hold | Swing | ||||
| Party | Candidate | Votes | % | ± | |
|---|---|---|---|---|---|
| Conservative | Beccy Hopfensperger | 1,360 | 53.69 | -4.8 | |
| UKIP | Linda Redford | 506 | 19.98 | ||
| Independent | Susan Glossop | 278 | 10.98 | ||
| Labour | Brian Turnbull | 216 | 8.53 | +1.5 | |
| Green | Natasha Ereira-Guyer | 173 | 6.83 | ||
| Majority | 854 | 33.7 | +9.8 | ||
| Turnout | 33.0 | ||||
| Conservative hold | Swing | ||||
| Party | Candidate | Votes | % | ± | |
|---|---|---|---|---|---|
| Conservative | Terry Clements | 1,306 | 49.75 | -13.3 | |
| UKIP | Bill Attwood | 760 | 28.95 | ||
| Labour | Jan Lavender | 320 | 12.19 | +2.2 | |
| Green | Ritchie Tennant | 239 | 9.1 | ||
| Majority | 546 | 20.8 | -15.3 | ||
| Turnout | |||||
| Conservative hold | Swing | ||||
| Party | Candidate | Votes | % | ± | |
|---|---|---|---|---|---|
| Conservative | Matthew Hicks | 1,293 | 49.46 | -13.3 | |
| Green | Nicholas Hardingham | 368 | 14.08 | ||
| Labour | James Higgins | 249 | 9.53 | +2.9 | |
| Liberal Democrats | Martin Redbond | 149 | 5.7 | ||
| Majority | 738 | 28.2 | -4.0 | ||
| Turnout | |||||
| Conservative hold | Swing | ||||
| Party | Candidate | Votes | % | ± | |
|---|---|---|---|---|---|
| Green | Mark Ereira | 1,481 | 16.37 | ||
| Independent | David Nettleton | 1,389 | 15.36 | ||
| Conservative | Robert Everitt | 1227 | 13.57 | -6.7 | |
| Conservative | Patsy Warby | 1008 | 11.14 | -6.0 | |
| UKIP | Luke Levene | 983 | 10.87 | ||
| Labour | Diane Hind | 895 | 9.89 | +3.5 | |
| Labour | Nicola Ridgeway | 840 | 9.29 | +3.1 | |
| UKIP | James Lumley | 823 | 9.1 | ||
| Liberal Democrats | Judy Roadway | 399 | 4.41 | ||
| Majority | 162 | ||||
| Turnout | |||||
| Green hold | Swing | ||||
| Independent gain from Conservative | Swing | ||||
| Party | Candidate | Votes | % | ± | |
|---|---|---|---|---|---|
| Green | Andrew Stringer | 1,536 | 53.11 | ||
| Conservative | Kevin Welsby | 596 | 20.61 | -16.3 | |
| UKIP | Roger Fouracre | 571 | 19.74 | ||
| Labour | Terry Wilson | 154 | 5.33 | 0.2 | |
| Liberal Democrats | Kay Field | 35 | 1.21 | ||
| Majority | 940 | 32.5 | +18.7 | ||
| Turnout | |||||
| Green hold | Swing | ||||
| Party | Candidate | Votes | % | ± | |
|---|---|---|---|---|---|
| Labour | Kathy Bole | 1,886 | 23.54 | +10.5 | |
| UKIP | James Crossley | 1,543 | 19.26 | ||
| Labour | Elango Elavalakkan | 1475 | 18.41 | +6.6 | |
| Conservative | Robin Vickery | 1141 | 14.24 | -8.6 | |
| Conservative | David Goldsmith | 1131 | 14.11 | -6.9 | |
| Green | Geoff Reynish | 458 | 5.72 | ||
| Liberal Democrats | Oliver Holmes | 206 | 2.57 | ||
| Liberal Democrats | Nicholas Jacob | 173 | 2.16 | ||
| Majority | 68 | 0.8 | -7.1 | ||
| Turnout | |||||
| Labour hold | Swing | ||||
| UKIP hold | Swing | ||||
| Party | Candidate | Votes | % | ± | |
|---|---|---|---|---|---|
| Conservative | Michael Bond | 1,214 | 46.58 | ||
| UKIP | Alan Ryall | 555 | 21.3 | ||
| Labour | Jeremy Bale | 527 | 20.22 | ||
| Liberal Democrats | John Ball | 310 | 11.9 | ||
| Majority | 659 | 25.3 | |||
| Turnout | |||||
| Conservative hold | Swing | ||||
| Party | Candidate | Votes | % | ± | |
|---|---|---|---|---|---|
| Conservative | Andrew Reid | 1,341 | 61.85 | +1.4 | |
| Labour | Howard Needham | 480 | 22.14 | +12.8 | |
| Liberal Democrats | Emma Greenhouse | 347 | 16.01 | -14.2 | |
| Majority | 861 | 39.7 | +9.3 | ||
| Turnout | 33.0 | ||||
| Conservative hold | Swing | ||||
| Party | Candidate | Votes | % | ± | |
|---|---|---|---|---|---|
| Liberal Democrats | Caroline Page | 1,127 | 41.73 | -5.5 | |
| Conservative | Patti Mulcahy | 870 | 32.21 | -7.6 | |
| UKIP | Pauline Staley | 327 | 12.11 | ||
| Labour | John White | 255 | 9.44 | +4.4 | |
| Green | Rachel Smith-Lyte | 122 | 4.52 | -3.5 | |
| Majority | 257 | 9.5 | |||
| Turnout | 42.0 | ||||
| Liberal Democrats hold | Swing | ||||
References
- "The Representation of the People (Form of Canvass) (England and Wales) Regulations 2006, Schedule Part 1". Legislation.gov.uk. 13 October 2011. Retrieved 18 April 2012.
- "I have two homes. Can I register at both addresses?". The Electoral Commission. Retrieved 5 January 2011.
External links
| Suffolk County Council | |
|---|---|
| Babergh District Council | |
| East Suffolk District Council | |
| Ipswich Borough Council | |
| Mid Suffolk District Council | |
| West Suffolk District Council | |
| East Suffolk County Council |
|
| Forest Heath District Council |
|
| St Edmundsbury Borough Council |
|
| Suffolk Coastal District Council | |
| Waveney District Council | |
| West Suffolk County Council |
|
| |
| County councils (England) |
| ||
|---|---|---|---|
| Unitary authorities (England) | |||
| Other English councils |
| ||
| Mayoral elections |
| ||
| Unitary authorities (Wales) | |||