2011 City of Lincoln Council election
Elections to City of Lincoln Council were held on Thursday 5 May 2011.
| |||||||||||||||||||||||||||||||||
All 33 seats to City of Lincoln Council 17 seats needed for a majority | |||||||||||||||||||||||||||||||||
|---|---|---|---|---|---|---|---|---|---|---|---|---|---|---|---|---|---|---|---|---|---|---|---|---|---|---|---|---|---|---|---|---|---|
| Turnout | 36.6% | ||||||||||||||||||||||||||||||||
| |||||||||||||||||||||||||||||||||
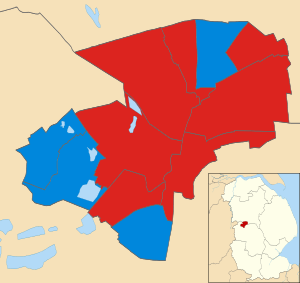 Map showing the results the 2011 Lincoln City Council elections by ward. Red shows Labour seats and blue shows the Conservatives. | |||||||||||||||||||||||||||||||||
| |||||||||||||||||||||||||||||||||
There were 11 seats up for election, one third of the councillors. The Labour Party gained control of the council, which had previously been under no overall control.
Election result
| Party | Seats | Gains | Losses | Net gain/loss | Seats % | Votes % | Votes | +/− | |
|---|---|---|---|---|---|---|---|---|---|
| Labour | 7 | 1 | 0 | 63.6 | 45.1 | 10,559 | |||
| Conservative | 4 | 1 | 0 | 36.4 | 36.6 | 8,573 | |||
| Liberal Democrats | 0 | 0 | 0 | 0 | 0.0 | 8.3 | 1,951 | ||
| UKIP | 0 | 0 | 0 | 0 | 0.0 | 7.1 | 1,664 | ||
| TUSC | 0 | 0 | 0 | 0 | 0.0 | 2.0 | 479 | ||
| Green | 0 | 0 | 0 | 0 | 0.0 | 0.9 | 205 | ||
Ward results
Abbey Ward
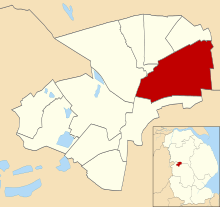
Location of Abbey ward
| Party | Candidate | Votes | % | |
|---|---|---|---|---|
| Labour | Fay Smith | 1,052 | 48.3% | |
| Conservative | Barry Reeves | 619 | 28.4% | |
| Liberal Democrats | Charly Harding-Price | 236 | 10.8% | |
| UKIP | Pat Nurse | 151 | 6.9% | |
| TUSC | Richard Steven Banks | 120 | 5.5% | |
| Majority | 433 | 19.9% | ||
| Turnout | 2,178 | 31.16% | ||
| Labour hold | ||||
Birchwood Ward
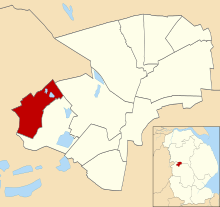
Location of Birchwood ward
| Party | Candidate | Votes | % | |
|---|---|---|---|---|
| Conservative | Eddie Strengiel | 847 | 41.9% | |
| Labour Co-op | Rosanne Kirk | 826 | 40.8% | |
| UKIP | Tony Wells | 205 | 10.1% | |
| Liberal Democrats | Jan Charters | 145 | 7.2% | |
| Majority | 21 | |||
| Turnout | 2,023 | 34.2% | ||
| Conservative hold | ||||
Boultham Ward
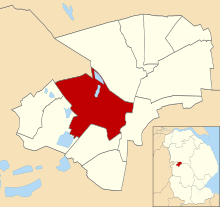
Location of Boultham ward
| Party | Candidate | Votes | % | |
|---|---|---|---|---|
| Labour | Gary Trevor Hewson | 1,196 | 54.8% | |
| Conservative | Sharon Dawn Longthorne | 671 | 30.8% | |
| UKIP | Nick Smith | 145 | 6.6% | |
| Liberal Democrats | Lynn Joan Pepper | 139 | 6.4% | |
| TUSC | Rupert Walker | 31 | 1.4% | |
| Majority | 525 | 24.1% | ||
| Turnout | 2182 | 39.92% | ||
| Labour hold | ||||
Bracebridge Ward
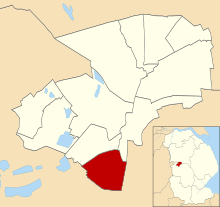
Location of Bracebridge ward
| Party | Candidate | Votes | % | |
|---|---|---|---|---|
| Conservative | Darren Peter Grice | 1,134 | 49.3% | |
| Labour | Bill Bilton | 932 | 40.5% | |
| UKIP | Callum Christophe Newton | 234 | 10.2% | |
| Majority | 202 | 8.8% | ||
| Turnout | 2,300 | 40.47% | ||
| Conservative hold | ||||
Carholme Ward
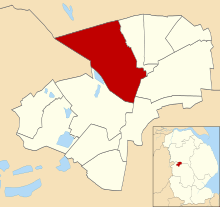
Location of Carholme ward
| Party | Candidate | Votes | % | |
|---|---|---|---|---|
| Labour | Neil McElhinny Murray | 1,248 | 47.5% | |
| Conservative | Vasos Melides | 594 | 22.6% | |
| Liberal Democrats | Charles William Shaw | 407 | 15.5% | |
| Green | Nicola Watson | 205 | 7.8% | |
| UKIP | Mike Murray | 113 | 4.3% | |
| TUSC | Nick Parker | 62 | 2.4% | |
| Majority | 654 | 24.9% | ||
| Turnout | 2,629 | |||
| Labour hold | ||||
Castle Ward
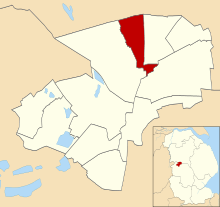
Location of Castle ward
| Party | Candidate | Votes | % | |
|---|---|---|---|---|
| Labour | Donald James Nannestad | 1,088 | 50.7% | |
| Conservative | Drew Anthony Stafford | 661 | 30.8% | |
| Liberal Democrats | Ross David Pepper | 194 | 9.0% | |
| UKIP | Peter Engel Kort | 144 | 6.7% | |
| TUSC | Dave Pike | 59 | 2.7% | |
| Majority | 427 | 19.9% | ||
| Turnout | 2,146 | |||
| Labour hold | ||||
Glebe Ward
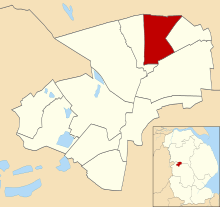
Location of Glebe ward
| Party | Candidate | Votes | % | |
|---|---|---|---|---|
| Labour | Patrick Joseph Vaughan | 832 | 43.8% | |
| Conservative | Paul Alan Lewis | 731 | 38.5% | |
| Liberal Democrats | David Harding-Price | 170 | 8.9% | |
| UKIP | Buffy-Jo Hogan | 110 | 5.8% | |
| TUSC | Gavyn Robert Graham | 58 | 3.1% | |
| Majority | 101 | 5.3% | ||
| Turnout | 1,901 | |||
| Labour gain from Conservative | ||||
Hartsholme Ward
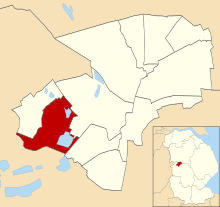
Location of Hartsholme ward
| Party | Candidate | Votes | % | |
|---|---|---|---|---|
| Conservative | Ronald Hills | 1,107 | 52.8% | |
| Labour | Sean Burke | 586 | 27.9% | |
| UKIP | Jane Smith | 206 | 9.8% | |
| Liberal Democrats | James Jopson Charters | 198 | 9.4% | |
| Majority | 521 | 24.8% | ||
| Turnout | 2,097 | |||
| Conservative hold | ||||
Minster Ward

Location of Minster ward
| Party | Candidate | Votes | % | |
|---|---|---|---|---|
| Conservative | David Frederick Gratrick | 1,018 | 43.7% | |
| Labour Co-op | Jim Hanrahan | 989 | 42.5% | |
| Liberal Democrats | Timothy Christopher McDonnell-Woods | 142 | 6.1% | |
| UKIP | Ken Pratt | 121 | 5.2% | |
| TUSC | Emma Woodhall | 57 | 2.4% | |
| Majority | 29 | 1.2% | ||
| Turnout | 2,327 | |||
| Conservative hold | ||||
Moorland Ward
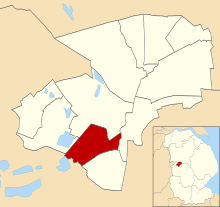
Location of Moorland ward
| Party | Candidate | Votes | % | |
|---|---|---|---|---|
| Labour | Bob Bushall | 962 | 46.7% | |
| Conservative | Keith James Weaver | 794 | 38.6% | |
| Liberal Democrats | Jenny Helen Shaw | 140 | 6.8% | |
| UKIP | David Frank Warde | 125 | 6.1% | |
| TUSC | Karen Elizabeth Williams | 37 | 1.8% | |
| Majority | 168 | 8.2% | ||
| Turnout | 2,058 | |||
| Labour gain from Conservative | ||||
Park Ward
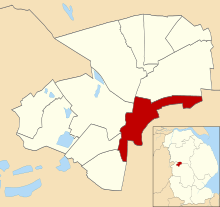
Location of Park ward
| Party | Candidate | Votes | % | |
|---|---|---|---|---|
| Labour | Chris Burke | 848 | 53.3% | |
| Conservative | Graham Kent | 397 | 25.0% | |
| Liberal Democrats | Heather Elizabeth Cullen | 180 | 11.3% | |
| UKIP | Hannah Poppy Smith | 110 | 6.9% | |
| TUSC | Harry Ziegler | 55 | 3.5% | |
| Majority | 451 | 28.4% | ||
| Turnout | 1,590 | |||
| Labour hold | ||||
gollark: Yes.
gollark: Yes.
gollark: ubq, I have prepared a "mostly working binary".
gollark: You configure it by manually updating a SQLite database!
gollark: I may eventually have to have some optional JS for a latency graph, but it shouldn't be necessary for basic features.
References
- Andrew Teale. "Local Election Results 2011". Local Elections Archive Project.
- Rallings, Colin; Thrasher, Michael (2011). Local Elections Handbook 2011 (PDF). University of Plymouth, Plymouth, UK: Local Government Chronicle Elections Centre. p. 10.
This article is issued from Wikipedia. The text is licensed under Creative Commons - Attribution - Sharealike. Additional terms may apply for the media files.