2009 Norfolk County Council election
The Norfolk County Council election took place on 4 June 2009, coinciding with local elections for all county councils in England.
| |||||||||||||||||||||||||||||||||||||||||||||||||||||
All 84 council division seats 43 seats needed for a majority | |||||||||||||||||||||||||||||||||||||||||||||||||||||
|---|---|---|---|---|---|---|---|---|---|---|---|---|---|---|---|---|---|---|---|---|---|---|---|---|---|---|---|---|---|---|---|---|---|---|---|---|---|---|---|---|---|---|---|---|---|---|---|---|---|---|---|---|---|
| |||||||||||||||||||||||||||||||||||||||||||||||||||||
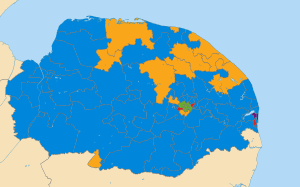 Map showing the results of the 2009 Norfolk County Council elections. | |||||||||||||||||||||||||||||||||||||||||||||||||||||
| |||||||||||||||||||||||||||||||||||||||||||||||||||||
The conservative administration was re-elected with an increased majority and, as in Suffolk and Kent, the liberal democrats replaced labour as the main opposition party.
The conservatives increased their majority on the council from 10 to a comfortable 36 seats with a net gain of 14 seats. They held virtually all of their seats across the county, but made a net loss of 1 seat to the liberal democrats in North Norfolk.
The liberal democrats performed well in the North Norfolk area through making a net gain of 1 against the Conservatives, and gaining Thetford West from Labour in Breckland, but lost seats to the conservatives in King's Lynn & West Norfolk and South Norfolk as the latter swept the board. Despite the party's flat-lining, they became the official opposition to the governing conservative administration.
Labour, just as had been the case across the rest of the country, suffered heavy losses to all parties and especially to the conservatives being left with just 3 seats across the county, being pushed in to 4th place behind the Green Party for the first time.
The green party made gains, particularly in Norwich where they won a majority of seats, which built upon their successes in city elections over the preceding years. They won more seats than labour across the county, but did not beat them in share of vote.
The United Kingdom Independence Party stood candidates in some seats, winning one in Great Yarmouth from Labour.
Other parties and independent candidates stood without winning seats and making little impact.
Summary of results
| Party | Seats | Gains | Losses | Net gain/loss | Seats % | Votes % | Votes | +/− | |
|---|---|---|---|---|---|---|---|---|---|
| Conservative | 60 | +14 | 71.4 | 45.9 | 115,363 | +6.7 | |||
| Liberal Democrats | 13 | -1 | 15.5 | 22.7 | 57,053 | -5.2 | |||
| Labour | 3 | -19 | 3.6 | 13.5 | 33,930 | -13.1 | |||
| Green | 7 | +5 | 8.3 | 10.9 | 27,395 | +6.3 | |||
| UKIP | 1 | +1 | 1.2 | 4.6 | 11,561 | +3.8 | |||
| Independents | 0 | ±0 | 1.4 | 3,518 | |||||
| BNP | 0 | ±0 | 0.9 | 2,262 | |||||
| Total | 84 | 251,082 | |||||||
Election of Group Leaders
Daniel Cox (Humbleyard) was re-elected leader of the Conservative Group, Paul Morse (North Walsham) was elected leader of the Liberal Democratic Group, Richard Bearman (Mancroft) was elected leader of the Green Party group and George Nobbs (Crome) became leader of the Labour Group now down to just 3 members.
Election of Leader of the Council
Daniel Cox the leader of the conservative group was duly re-elected leader of the council and formed a conservative administration.
Graphic version of results
Results by district
Gains and losses are in comparison to the preceding full election in 2005, unless otherwise stated. Intervening by-elections are noted.
Breckland
| Party | Candidate | Votes | % | |
|---|---|---|---|---|
| Conservative | Alec Byrne | 1,659 | 58.17 | |
| Green | Tony Arthur Park | 834 | 29.24 | |
| Labour | Janet Susan King | 359 | 12.59 | |
| Majority | 825 | 28.93 | ||
| Turnout | 2852 | 33.73 | ||
| Conservative hold | ||||
| Party | Candidate | Votes | % | |
|---|---|---|---|---|
| Conservative | Diana Irving | 1,422 | 53.88 | |
| Green | Ann Bowyer | 774 | 29.33 | |
| Labour | Tom Goreham | 443 | 16.79 | |
| Majority | 648 | 24.55 | ||
| Turnout | 2639 | 35.05 | ||
| Conservative hold | ||||
| Party | Candidate | Votes | % | |
|---|---|---|---|---|
| Conservative | Phillip Duigan | 1,208 | 45.33 | |
| Labour | Robin Frederick Goreham | 705 | 26.45 | |
| Green | Timothy Edward Birt | 427 | 16.02 | |
| Liberal Democrats | Pat Dore | 325 | 12.20 | |
| Majority | 503 | 18.87 | ||
| Turnout | 2665 | 31.85 | ||
| Conservative gain from Labour | ||||
| Party | Candidate | Votes | % | |
|---|---|---|---|---|
| Conservative | Bill Borrett | 1,689 | 45.04 | |
| Independent | Roger David Atterwill | 1,184 | 31.57 | |
| Green | Steve David Blake | 558 | 14.88 | |
| Labour | Linda Goreham | 319 | 8.51 | |
| Majority | 505 | 13.47 | ||
| Turnout | 3750 | 43.91 | ||
| Conservative hold | ||||
| Party | Candidate | Votes | % | |
|---|---|---|---|---|
| Conservative | William Nunn | 1,775 | 51.90 | |
| Liberal Democrats | Stephen Joseph Gordon | 599 | 17.51 | |
| Green | Donna Rose Park | 433 | 12.66 | |
| Independent | Colin Phillips | 381 | 11.14 | |
| Labour | Mark James Allison | 232 | 6.78 | |
| Majority | 1176 | 34.39 | ||
| Turnout | 3420 | 42.88 | ||
| Conservative hold | ||||
| Party | Candidate | Votes | % | |
|---|---|---|---|---|
| Conservative | Mark Kiddle-Morris | 2,261 | 61.67% | |
| Liberal Democrats | Ann Dorothy Gunner | 875 | 23.87 | |
| Labour | Michael Fanthorpe | 530 | 14.46 | |
| Majority | 1386 | 37.81 | ||
| Turnout | 3666 | 44.39 | ||
| Conservative hold | ||||
| Party | Candidate | Votes | % | |
|---|---|---|---|---|
| Conservative | Ann Steward | 1,440 | 53.06 | |
| Liberal Democrats | Charles Gunner | 507 | 18.68 | |
| Green | Nigel Henry Walker | 438 | 16.14 | |
| Labour | Sandra Caroline Kerridge | 329 | 12.12 | |
| Majority | 933 | 34.38 | ||
| Turnout | 2714 | 37.39 | ||
| Conservative hold | ||||
| Party | Candidate | Votes | % | |
|---|---|---|---|---|
| Conservative | Ian Monson | 2,612 | 79.66 | |
| Labour | Dennis Wilbert Robert Sully | 667 | 20.34 | |
| Majority | 1945 | 59.32 | ||
| Turnout | 3279 | 38.51 | ||
| Conservative hold | ||||
| Party | Candidate | Votes | % | |
|---|---|---|---|---|
| Conservative | Marion Chapman-Allen | 1,036 | 49.62 | |
| Liberal Democrats | Margaret Rutter | 665 | 31.85 | |
| Labour | Brenda June Canham | 387 | 18.53 | |
| Majority | 371 | 17.77 | ||
| Turnout | 2088 | 29.84 | ||
| Conservative gain from Labour | ||||
| Party | Candidate | Votes | % | |
|---|---|---|---|---|
| Liberal Democrats | Mike Brindle | 934 | 37.03 | |
| Conservative | Robert Kybird | 882 | 34.97 | |
| Labour | Terry James Jermy | 706 | 27.99 | |
| Majority | 52 | 2.06 | ||
| Turnout | 2522 | 27.49 | ||
| Liberal Democrats gain from Labour | ||||
| Party | Candidate | Votes | % | |
|---|---|---|---|---|
| Conservative | John Rogers | 1,843 | 76.63 | |
| Labour | Chris Walls | 562 | 23.37 | |
| Majority | 1281 | 53.26 | ||
| Turnout | 2405 | 31.19 | ||
| Conservative hold | ||||
| Party | Candidate | Votes | % | |
|---|---|---|---|---|
| Conservative | Cliff Jordan | 2,186 | 79.17 | |
| Labour | Julian Patrick Crutch | 575 | 20.83 | |
| Majority | 1611 | 58.35 | ||
| Turnout | 2761 | 38.25 | ||
| Conservative hold | ||||
Broadland
| Party | Candidate | Votes | % | |
|---|---|---|---|---|
| Conservative | Brian Iles | 1,486 | 58.65 | |
| Liberal Democrats | Jane Key | 626 | 24.72 | |
| Labour | Anthony Hemmingway | 421 | 16.63 | |
| Majority | 859 | 34.0 | ||
| Turnout | 2532 | 38.42 | ||
| Conservative hold | ||||
| Party | Candidate | Votes | % | |
|---|---|---|---|---|
| Liberal Democrats | David Harrison | 1,662 | 53.79 | |
| Conservative | Ian Graham | 1,218 | 39.42 | |
| Labour | Deborah Kemp | 210 | 6.80 | |
| Majority | 444 | 14.0 | ||
| Turnout | 3090 | 42.98 | ||
| Liberal Democrats hold | ||||
| Party | Candidate | Votes | % | |
|---|---|---|---|---|
| Conservative | Andrew James Proctor | 1,947 | 63.63 | |
| Liberal Democrats | Joyce Groves | 768 | 25.10 | |
| Labour | Christine Mary Hemmingway | 345 | 11.27 | |
| Majority | 1179 | 38.53 | ||
| Turnout | 3060 | 42.95 | ||
| Conservative hold | ||||
| Party | Candidate | Votes | % | |
|---|---|---|---|---|
| Conservative | Tony Adams | 1,302 | 49.45 | |
| Liberal Democrats | Peter Sergeant | 711 | 27.0 | |
| Green | Rachel Heeds | 408 | 15.50 | |
| Labour | Michael Cox | 212 | 8.05 | |
| Majority | 591 | 22.0 | ||
| Turnout | 2633 | 34.73 | ||
| Conservative hold | ||||
| Party | Candidate | Votes | % | |
|---|---|---|---|---|
| Conservative | Shelagh Gurney | 1,408 | 45.92 | |
| UKIP | John Youles | 592 | 19.04 | |
| Liberal Democrats | Peter Fish | 520 | 16.73 | |
| Labour | Wendy Thorogood | 364 | 11.71 | |
| Green | Jennifer Parkhouse | 225 | 7.24 | |
| Majority | 816 | 26.25 | ||
| Turnout | 3109 | 35.42 | ||
| Conservative hold | ||||
| Party | Candidate | Votes | % | |
|---|---|---|---|---|
| Conservative | Tony Williams | 1,198 | 43.05 | |
| Liberal Democrats | Daniel Roper | 1,075 | 38.63 | |
| Green | Susan Curran | 332 | 11.93 | |
| Labour | Richard Powell | 178 | 6.40 | |
| Majority | 123 | 4.42 | ||
| Turnout | 2783 | 39.96 | ||
| Conservative hold | ||||
| Party | Candidate | Votes | % | |
|---|---|---|---|---|
| Conservative | Stuart Dunn | 1,206 | 48.81 | |
| UKIP | Susan Sadler | 402 | 16.27 | |
| Liberal Democrats | Nigel Steane | 334 | 13.52 | |
| Labour | Kenneth Lashley | 267 | 10.81 | |
| Green | Thomas Wedge-Roberts | 262 | 10.60 | |
| Majority | 804 | 32.54 | ||
| Turnout | 2471 | 38.27 | ||
| Conservative hold | ||||
At a by-election held on 14 July 2011, Old Catton was retained by the Conservatives.
| Party | Candidate | Votes | % | |
|---|---|---|---|---|
| Liberal Democrats | James Joyce | 1,426 | 52.5 | |
| Conservative | Simon Woodbridge | 1,120 | 41.2 | |
| Labour | Christopher Jones | 173 | 6.4 | |
| Majority | 306 | 11.3 | ||
| Turnout | 2719 | 43.62 | ||
| Liberal Democrats hold | ||||
| Party | Candidate | Votes | % | |
|---|---|---|---|---|
| Conservative | John Ward | 1,123 | 32.37 | |
| UKIP | Glenn Tingle | 663 | 19.11 | |
| Labour | Barbara Lashley | 593 | 17.09 | |
| Liberal Democrats | Corrine Russen | 564 | 16.26 | |
| Green | James Dexter | 298 | 8.59 | |
| BNP | Julia Howman | 228 | 6.57 | |
| Majority | 460 | 13.26 | ||
| Turnout | 3469 | 37.65 | ||
| Conservative hold | ||||
| Party | Candidate | Votes | % | |
|---|---|---|---|---|
| Conservative | Stuart Clancy | 1,554 | 57.32 | |
| Liberal Democrats | Julia Holland | 562 | 20.73 | |
| Green | Ben Duffy | 334 | 12.32 | |
| Labour | Jason Bill | 261 | 9.63 | |
| Majority | 992 | 35.59 | ||
| Turnout | 2711 | 36.01 | ||
| Conservative hold | ||||
| Party | Candidate | Votes | % | |
|---|---|---|---|---|
| Conservative | Ian James Mackie | 1,627 | 57.78 | |
| Liberal Democrats | Phyllida Isobel Margaret Scrivens | 502 | 17.83 | |
| Green | Nicholas Caistor | 383 | 13.60 | |
| Labour | Lesley Anne Barrett | 304 | 10.80 | |
| Majority | 1125 | 39.95 | ||
| Turnout | 2816 | 37.78 | ||
| Conservative hold | ||||
| Party | Candidate | Votes | % | |
|---|---|---|---|---|
| Conservative | Nigel Christopher Shaw | 1,202 | 48.59 | |
| Liberal Democrats | Sylvia Marguerite Cannon | 456 | 18.43 | |
| Labour | Pam Harwood | 447 | 18.07 | |
| Green | Christopher Webb | 369 | 14.92 | |
| Majority | 746 | 30.15 | ||
| Turnout | 2474 | 38.78 | ||
| Conservative hold | ||||
| Party | Candidate | Votes | % | |
|---|---|---|---|---|
| Conservative | James Alexander Carswell | 1,788 | 56.46 | |
| Green | Nick Ball | 603 | 19.04 | |
| Liberal Democrats | Veronica Mary Beadle | 485 | 15.31 | |
| Labour | Malcolm Kenneth Kemp | 291 | 9.19 | |
| Majority | 1185 | 37.42 | ||
| Turnout | 3167 | 40.68 | ||
| Conservative hold | ||||
Great Yarmouth
| Party | Candidate | Votes | % | |
|---|---|---|---|---|
| Conservative | Graham Robert Plant | 960 | 35.22 | |
| Labour | Trevor John Wainwright | 891 | 32.69 | |
| UKIP | Wayne Paul Beckett | 675 | 24.76 | |
| Green | Karen Marie Groom | 200 | 7.34 | |
| Majority | 69 | 2.53 | ||
| Turnout | 2726 | 32.11 | ||
| Conservative gain from Labour | ||||
| Party | Candidate | Votes | % | |
|---|---|---|---|---|
| Conservative | Ronald Charles Hanton | 1,480 | 54.03 | |
| Labour | Patrick Thaine Hacon | 786 | 28.70 | |
| Liberal Democrats | Richard Payne Harbord | 473 | 17.27 | |
| Majority | 694 | 25.34 | ||
| Turnout | 2739 | 38.38 | ||
| Conservative gain from Labour | ||||
| Party | Candidate | Votes | % | |
|---|---|---|---|---|
| Conservative | James Robert Shrimplin | 1,772 | 59.89 | |
| Green | Andrew Mark Taylor | 431 | 14.57 | |
| Liberal Democrats | Rodney Alec Cole | 419 | 14.16 | |
| Labour | Nicholas Dack | 337 | 11.39 | |
| Majority | 1341 | 45.32 | ||
| Turnout | 2959 | 40.57 | ||
| Conservative hold | ||||
| Party | Candidate | Votes | % | |
|---|---|---|---|---|
| Conservative | Bertie James Edmund Collins | 1,223 | 48.47 | |
| UKIP | Alan James Baugh | 728 | 28.85 | |
| Labour | Christine Williamson | 572 | 22.67 | |
| Majority | 495 | 19.62 | ||
| Turnout | 2523 | 33.55 | ||
| Conservative hold | ||||
| Party | Candidate | Votes | % | |
|---|---|---|---|---|
| Conservative | Patrick Gerald Cook | 1,326 | 45.43 | |
| UKIP | Colin Aldred | 948 | 32.48 | |
| Labour | Brian Walker | 645 | 22.10 | |
| Majority | 378 | 12.95 | ||
| Turnout | 2919 | 34.22 | ||
| Conservative gain from Labour | ||||
At a by-election on 5 May 2011, Lothingland was retained by the Conservatives.
| Party | Candidate | Votes | % | |
|---|---|---|---|---|
| Labour | Colleen Walker | 917 | 36.10 | |
| Conservative | Patricia Elizabeth Page | 861 | 33.90 | |
| UKIP | Karl Julian Ruane | 762 | 30.0 | |
| Majority | 56 | 2.20 | ||
| Turnout | 2540 | 30.93 | ||
| Labour hold | ||||
| Party | Candidate | Votes | % | |
|---|---|---|---|---|
| Conservative | Michael Carttiss | 1,331 | 58.84 | |
| Liberal Democrats | Pamela Mayhew | 651 | 28.78 | |
| Labour | Katie James | 280 | 12.38 | |
| Majority | 680 | 30.06 | ||
| Turnout | 2262 | 38.33 | ||
| Conservative hold | ||||
| Party | Candidate | Votes | % | |
|---|---|---|---|---|
| UKIP | Rex Edgar Parkinson-Hare | 779 | 38.34 | |
| Labour | John Alfred Holmes | 702 | 34.55 | |
| Conservative | Matthew James Smith | 551 | 27.12 | |
| Majority | 77 | 3.79 | ||
| Turnout | 2032 | 21.98 | ||
| UKIP gain from Labour | ||||
| Party | Candidate | Votes | % | |
|---|---|---|---|---|
| Conservative | Thomas Steven Charles Garrod | 1,001 | 34.14 | |
| Labour | Michael Taylor | 856 | 29.20 | |
| UKIP | Paul Andrew Baugh | 549 | 18.72 | |
| Liberal Democrats | Anthony John Harris | 278 | 9.48 | |
| BNP | David George Rand | 248 | 8.46 | |
| Majority | 145 | 4.95 | ||
| Turnout | 2932 | 32.16 | ||
| Conservative gain from Labour | ||||
King's Lynn and West Norfolk
| Party | Candidate | Votes | % | |
|---|---|---|---|---|
| Conservative | David Harwood | 1,015 | 39.25 | |
| Liberal Democrats | Judith Brown | 743 | 28.73 | |
| BNP | Matthew Gant | 313 | 12.10 | |
| Labour | Margaret Rose Wilkinson | 301 | 11.64 | |
| Green | John Andrew Edmund Belfield | 214 | 8.28 | |
| Majority | 272 | 10.52 | ||
| Turnout | 2586 | 34.89 | ||
| Conservative gain from Liberal Democrats | ||||
At a by-election on 27 September 2012, Clenchwarton and King's Lynn South was won by the Labour Party.
| Party | Candidate | Votes | % | |
|---|---|---|---|---|
| Conservative | John Dobson | 1,648 | 43.18 | |
| Independent | Janice Eells | 800 | 20.96 | |
| Liberal Democrats | Kate Sayer | 614 | 16.09 | |
| Labour | Richard William Pennington | 438 | 11.47 | |
| Green | David John Rogers | 317 | 8.30 | |
| Majority | 848 | 22.22 | ||
| Turnout | 3817 | 44.02 | ||
| Conservative hold | ||||
| Party | Candidate | Votes | % | |
|---|---|---|---|---|
| Conservative | Michael John Baylis Chenery of Horsbrugh | 1,833 | 55.55 | |
| Liberal Democrats | Colin Sayer | 537 | 16.27 | |
| Green | Benedict Patrick Butler | 492 | 14.91 | |
| Labour | Ian Gourlay | 438 | 13.27 | |
| Majority | 1296 | 39.27 | ||
| Turnout | 3300 | 40.13 | ||
| Conservative hold | ||||
| Party | Candidate | Votes | % | |
|---|---|---|---|---|
| Conservative | Shelagh Elizabeth Lucy Hutson | 1,660 | 60.54 | |
| Labour | Johnathan Toye | 432 | 15.75 | |
| Liberal Democrats | Teresa Dawn Brandon | 365 | 13.31 | |
| Green | Frank Federick Abel | 285 | 10.39 | |
| Majority | 1228 | 44.78 | ||
| Turnout | 2742 | 36.63 | ||
| Conservative hold | ||||
| Party | Candidate | Votes | % | |
|---|---|---|---|---|
| Conservative | Tony White | 1,835 | 54.76 | |
| Liberal Democrats | Carol Ann Nicholas-Letch | 732 | 21.84 | |
| Green | Andrew John Smith | 547 | 16.32 | |
| Labour | Albert Paines | 237 | 7.07 | |
| Majority | 1103 | 32.92 | ||
| Turnout | 3351 | 36.68 | ||
| Conservative hold | ||||
| Party | Candidate | Votes | % | |
|---|---|---|---|---|
| Conservative | Richard Rockcliffe | 2,132 | 66.71 | |
| Liberal Democrats | John Nicholas-Letch | 705 | 22.06 | |
| Labour | Steve Richard Everett | 359 | 11.23 | |
| Majority | 1427 | 44.65 | ||
| Turnout | 3196 | 38.52 | ||
| Conservative hold | ||||
| Party | Candidate | Votes | % | |
|---|---|---|---|---|
| Conservative | Derrick Murphy | 1,690 | 54.50 | |
| Liberal Democrats | Mark Seaman | 431 | 13.90 | |
| Green | Michael De Whalley | 385 | 12.42 | |
| Labour | Christopher John Bunting | 347 | 11.19 | |
| BNP | Ronald Barnes | 248 | 8.00 | |
| Majority | 1259 | 40.60 | ||
| Turnout | 3101 | 41.90 | ||
| Conservative hold | ||||
| Party | Candidate | Votes | % | |
|---|---|---|---|---|
| Conservative | Janet Ann Murphy | 1,856 | 60.75 | |
| Green | Lori Allen | 739 | 24.19 | |
| Labour | Gwyneth Eve Thorneywork | 460 | 15.06 | |
| Majority | 1117 | 36.56 | ||
| Turnout | 3055 | 38.38 | ||
| Conservative hold | ||||
| Party | Candidate | Votes | % | |
|---|---|---|---|---|
| Conservative | Jean Mickleburgh | 1,090 | 42.38 | |
| Labour | Alexandra Elvina Kemp | 445 | 17.30 | |
| Liberal Democrats | Ian Swinton | 369 | 14.35 | |
| BNP | Edith Crowther | 346 | 13.45 | |
| Green | David Lefever | 322 | 12.52 | |
| Majority | 645 | 25.08 | ||
| Turnout | 2572 | 34.43 | ||
| Conservative hold | ||||
| Party | Candidate | Votes | % | |
|---|---|---|---|---|
| Conservative | Michael Collins Langwade | 865 | 32.08 | |
| Labour | Charles Edward Joyce | 551 | 20.44 | |
| Liberal Democrats | John Loveless | 435 | 16.14 | |
| UKIP | Michael Stone | 376 | 13.95 | |
| BNP | Christine Ann Kelly | 273 | 10.13 | |
| Green | Vivienne Jane Manning | 196 | 7.27 | |
| Majority | 314 | 11.65 | ||
| Turnout | 2696 | 28.57 | ||
| Conservative gain from Labour | ||||
| Party | Candidate | Votes | % | |
|---|---|---|---|---|
| Conservative | Brian Winston Charles Long | 677 | 32.66 | |
| Labour | John Leonard Collop | 616 | 29.72 | |
| BNP | David Alexander Fleming | 431 | 20.79 | |
| Green | Johnathan Priestley Burr | 349 | 16.84 | |
| Majority | 61 | 2.94 | ||
| Turnout | 2073 | 26.63 | ||
| Conservative gain from Labour | ||||
| Party | Candidate | Votes | % | |
|---|---|---|---|---|
| Conservative | Tony Wright | 1,881 | 79.74 | |
| Labour | Mark Lachlan Daspa Anderson | 478 | 20.26 | |
| Majority | 1403 | 59.47 | ||
| Turnout | 2359 | 31.40 | ||
| Conservative hold | ||||
| Party | Candidate | Votes | % | |
|---|---|---|---|---|
| Conservative | Harry Humphrey | 1,628 | 51.0 | |
| Independent | David Peter Barnard | 599 | 18.77 | |
| Green | Ian Massingham | 383 | 12.0 | |
| Independent | David Dennis Markinson | 241 | 7.55 | |
| Labour | Helen Scott | 229 | 7.17 | |
| Independent | James Van Der Velde | 112 | 3.51 | |
| Majority | 1029 | 32.24 | ||
| Turnout | 3192 | 33.51 | ||
| Conservative hold | ||||
| Party | Candidate | Votes | % | |
|---|---|---|---|---|
| Conservative | Stephen Bett | 2,152 | 62.83 | |
| Liberal Democrats | Paul Richard Burall | 444 | 12.96 | |
| Green | Adam Watson | 436 | 12.73 | |
| Labour | John Raymond Barnett Crisford | 393 | 11.47 | |
| Majority | 1708 | 49.87 | ||
| Turnout | 3425 | 41.74 | ||
| Conservative hold | ||||
North Norfolk
| Party | Candidate | Votes | % | |
|---|---|---|---|---|
| Conservative | Hilary Thompson | 1,463 | 41.97 | |
| Liberal Democrats | Penny Bevan Jones | 1,127 | 32.33 | |
| UKIP | Bob Russell | 666 | 19.10 | |
| Labour | Colin John Vanlint | 230 | 6.60 | |
| Majority | 336 | 9.64 | ||
| Turnout | 3486 | 43.24 | ||
| Conservative gain from Liberal Democrats | ||||
| Party | Candidate | Votes | % | |
|---|---|---|---|---|
| Liberal Democrats | David Robert Callaby | 1,452 | 51.56 | |
| Conservative | John Victor Rest | 1,085 | 38.53 | |
| Labour | Brenda Mary Coldrick | 279 | 9.91 | |
| Majority | 367 | 13.03 | ||
| Turnout | 2816 | 35.51 | ||
| Conservative hold | ||||
| Party | Candidate | Votes | % | |
|---|---|---|---|---|
| Conservative | John Hase Perry-Warnes | 1,558 | 38.79 | |
| UKIP | Michael John Morton Baker | 1,073 | 26.72 | |
| Liberal Democrats | Jacqueline Ann Howe | 1,058 | 26.34 | |
| Green | Paula Mary D'Attoma | 222 | 5.53 | |
| Labour | John Rowley | 105 | 2.61 | |
| Majority | 485 | 12.08 | ||
| Turnout | 4016 | 54.43 | ||
| Conservative hold | ||||
| Party | Candidate | Votes | % | |
|---|---|---|---|---|
| Conservative | Nigel David Dixon | 1,381 | 49.84 | |
| Liberal Democrats | Candy Paula Sheridan | 1,171 | 42.26 | |
| Labour Co-op | David Russell | 219 | 7.90 | |
| Majority | 210 | 7.58 | ||
| Turnout | 2771 | 41.49 | ||
| Conservative hold | ||||
| Party | Candidate | Votes | % | |
|---|---|---|---|---|
| Conservative | Russell John Wright | 1,415 | 40.88 | |
| Liberal Democrats | Barbara Helen Rix | 1,015 | 29.33 | |
| UKIP | Terry Cox | 532 | 15.37 | |
| Green | Sharon Harvey | 317 | 9.16 | |
| Labour | Timothy John Bartlett | 182 | 5.26 | |
| Majority | 400 | 11.56 | ||
| Turnout | 3461 | 46.88 | ||
| Conservative gain from Liberal Democrats | ||||
| Party | Candidate | Votes | % | |
|---|---|---|---|---|
| Liberal Democrats | Graham Robert Jones | 1,919 | 54.64 | |
| Conservative | Alistair James MacKay | 1,416 | 40.32 | |
| Labour Co-op | David Gregory Spencer | 177 | 5.04 | |
| Majority | 503 | 14.32 | ||
| Turnout | 3512 | 48.60 | ||
| Liberal Democrats gain from Conservative | ||||
| Party | Candidate | Votes | % | |
|---|---|---|---|---|
| Liberal Democrats | Paul Donald Morse | 1,909 | 52.40 | |
| Conservative | Carole Irene Bullinger | 880 | 24.16 | |
| UKIP | Charles Edward Cole | 464 | 12.74 | |
| Green | Joanne Todd | 201 | 5.52 | |
| Labour | Nicola Kate Mortin | 189 | 5.19 | |
| Majority | 1029 | 28.25 | ||
| Turnout | 3643 | 41.53 | ||
| Liberal Democrats hold | ||||
| Party | Candidate | Votes | % | |
|---|---|---|---|---|
| Liberal Democrats | Diana Clarke | 1,675 | 53.91 | |
| Conservative | Peter Joseph Willcox | 1,214 | 39.07 | |
| Labour Co-op | Phil Harris | 218 | 7.02 | |
| Majority | 461 | 14.84 | ||
| Turnout | 3107 | 44.08 | ||
| Liberal Democrats hold | ||||
| Party | Candidate | Votes | % | |
|---|---|---|---|---|
| Liberal Democrats | Brian John Hannah | 1,835 | 59.12 | |
| Conservative | Madeleine Barbara Ashcroft | 1,140 | 36.73 | |
| Labour Co-op | Don Batts | 129 | 4.16 | |
| Majority | 695 | 22.39 | ||
| Turnout | 3104 | 45.31 | ||
| Liberal Democrats hold | ||||
| Party | Candidate | Votes | % | |
|---|---|---|---|---|
| Liberal Democrats | Paul Kenneth Rice | 1,283 | 38.67 | |
| Conservative | Lorraine Marie West | 1,144 | 34.48 | |
| UKIP | Jeff Parkes | 693 | 20.89 | |
| Labour | Sheila Ann Cullingham | 198 | 5.97 | |
| Majority | 139 | 4.19 | ||
| Turnout | 3318 | 46.31 | ||
| Liberal Democrats gain from Conservative | ||||
| Party | Candidate | Votes | % | |
|---|---|---|---|---|
| Liberal Democrats | Marie Strong | 1,650 | 50.32 | |
| Conservative | Garry James Sandell | 1,348 | 41.11 | |
| Labour | Mike Gates | 281 | 8.57 | |
| Majority | 302 | 9.21 | ||
| Turnout | 3279 | 47.17 | ||
| Liberal Democrats gain from Conservative | ||||
Norwich
| Party | Candidate | Votes | % | |
|---|---|---|---|---|
| Conservative | Paul Anthony George Wells | 926 | 35.60 | |
| Labour | Jo Storie | 670 | 25.76 | |
| Liberal Democrats | Dave Thomas | 626 | 24.07 | |
| Green | Christine Patricia Way | 379 | 14.57 | |
| Majority | 256 | 9.84 | ||
| Turnout | 2601 | 31.60 | ||
| Conservative gain from Labour | ||||
| Party | Candidate | Votes | % | |
|---|---|---|---|---|
| Conservative | Charlotte Louise Casimir | 724 | 29.53 | |
| Labour | Brian Morrey | 606 | 24.71 | |
| UKIP | Ann Doris Williams | 449 | 18.31 | |
| Green | Penny Edwards | 416 | 16.97 | |
| Liberal Democrats | Adrian Christopher Thomas | 257 | 10.48 | |
| Majority | 118 | 4.81 | ||
| Turnout | 2452 | 31.95 | ||
| Conservative gain from Labour | ||||
| Party | Candidate | Votes | % | |
|---|---|---|---|---|
| Labour | George Nobbs | 811 | 33.48 | |
| Conservative | Jonathan James Emsell | 712 | 29.40 | |
| Green | Penelope Mary Killingbeck | 518 | 21.39 | |
| Liberal Democrats | Dal Dewgarde | 381 | 15.73 | |
| Majority | 99 | 4.09 | ||
| Turnout | 2422 | 34.55 | ||
| Labour hold | ||||
| Party | Candidate | Votes | % | |
|---|---|---|---|---|
| Liberal Democrats | Mervyn John Scutter | 1,688 | 41.50 | |
| Conservative | Niall Baxter | 1,501 | 36.91 | |
| Green | Jean Kathleen Bishop | 527 | 12.96 | |
| Labour | Christopher Harold Knapp | 351 | 8.63 | |
| Majority | 187 | 4.60 | ||
| Turnout | 4067 | 57.19 | ||
| Liberal Democrats hold | ||||
| Party | Candidate | Votes | % | |
|---|---|---|---|---|
| Liberal Democrats | Fiona Clare Williamson | 877 | 31.65 | |
| Labour | Susan Jane Whitaker | 743 | 26.81 | |
| UKIP | Steve Emmens | 437 | 15.77 | |
| Conservative | Christopher David Benjamin | 361 | 13.03 | |
| Green | Lee Claire Cozens | 353 | 12.74 | |
| Majority | 134 | 4.84 | ||
| Turnout | 2771 | 39.47 | ||
| Liberal Democrats gain from Labour | ||||
At a by-election on 24 November 2011, Lakenham was regained by the Labour Party.
| Party | Candidate | Votes | % | |
|---|---|---|---|---|
| Green | Richard Andrew Bearman | 1,123 | 41.86 | |
| Liberal Democrats | Simon Richard Nobbs | 535 | 19.94 | |
| Conservative | Suzanne Amy Pulford | 515 | 19.19 | |
| Labour | David Fullman | 510 | 19.01 | |
| Majority | 588 | 21.92 | ||
| Turnout | 2683 | 35.98 | ||
| Green gain from Labour | ||||
| Party | Candidate | Votes | % | |
|---|---|---|---|---|
| Green | Richard Alan Edwards | 620 | 29.54 | |
| Labour | Peter John Harwood | 614 | 29.25 | |
| Conservative | Clive Smith | 547 | 26.06 | |
| Liberal Democrats | Peter Balcombe | 318 | 15.15 | |
| Majority | 6 | 0.29 | ||
| Turnout | 2099 | 28.43 | ||
| Green gain from Labour | ||||
| Party | Candidate | Votes | % | |
|---|---|---|---|---|
| Green | Andrew Philip Boswell | 2,103 | 63.75 | |
| Labour | Gemma Rose Ricketts | 421 | 12.76 | |
| Liberal Democrats | Gordon Dean | 420 | 12.73 | |
| Conservative | Stefan Richard Rose | 355 | 10.76 | |
| Majority | 1682 | 50.99 | ||
| Turnout | 3299 | 45.48 | ||
| Green hold | ||||
| Party | Candidate | Votes | % | |
|---|---|---|---|---|
| Green | Jennifer Susan Toms | 826 | 32.62 | |
| Labour | Cath Ward | 676 | 26.70 | |
| Conservative | David John Mackie | 553 | 21.84 | |
| Liberal Democrats | Ian Williams | 477 | 18.84 | |
| Majority | 150 | 5.92 | ||
| Turnout | 2532 | 34.08 | ||
| Green gain from Labour | ||||
| Party | Candidate | Votes | % | |
|---|---|---|---|---|
| Green | Philip Allan Hardy | 1,371 | 46.16 | |
| Liberal Democrats | David John Munday | 620 | 20.88 | |
| Conservative | Matthew Simon Davison | 573 | 19.29 | |
| Labour | Cym Cant | 406 | 13.67 | |
| Majority | 751 | 25.29 | ||
| Turnout | 2970 | 37.18 | ||
| Green gain from Liberal Democrats | ||||
| Party | Candidate | Votes | % | |
|---|---|---|---|---|
| Green | Stephen Ralph Little | 1,528 | 42.69 | |
| Liberal Democrats | Victor Keith Scrivens | 859 | 24.0 | |
| Conservative | Tak-Man Li | 716 | 20.01 | |
| Labour | Andreas Kevin Paterson | 476 | 13.30 | |
| Majority | 669 | 18.69 | ||
| Turnout | 3579 | 44.45 | ||
| Green hold | ||||
| Party | Candidate | Votes | % | |
|---|---|---|---|---|
| Labour | Bert Bremner | 1,047 | 40.68 | |
| Green | Steven Martin Altman | 914 | 35.51 | |
| Conservative | Mark Nigel Edward Patrick | 342 | 13.29 | |
| Liberal Democrats | Andrew Norris Wright | 271 | 10.53 | |
| Majority | 133 | 5.17 | ||
| Turnout | 2574 | 34.01 | ||
| Labour hold | ||||
| Party | Candidate | Votes | % | |
|---|---|---|---|---|
| Green | Marcus Hemsley | 1,260 | 49.39 | |
| Labour | Vaughan Thomas | 561 | 21.99 | |
| Conservative | Mike Gillespie | 445 | 17.44 | |
| Liberal Democrats | Haydn Perrett | 285 | 11.17 | |
| Majority | 699 | 27.40 | ||
| Turnout | 2551 | 31.90 | ||
| Green gain from Labour | ||||
South Norfolk
| Party | Candidate | Votes | % | |
|---|---|---|---|---|
| Conservative | Tony Tomkinson | 1,492 | 39.59 | |
| Liberal Democrats | Amanda Anne Smith | 989 | 26.24 | |
| UKIP | David Gifford | 653 | 17.33 | |
| Green | Derek William West | 405 | 10.75 | |
| Labour | John Shanahan | 230 | 6.10 | |
| Majority | 503 | 13.35 | ||
| Turnout | 3769 | 44.90 | ||
| Conservative gain from Liberal Democrats | ||||
| Party | Candidate | Votes | % | |
|---|---|---|---|---|
| Liberal Democrats | Tim East | 1,768 | 54.80 | |
| Conservative | Simon Richard Squire | 797 | 24.71 | |
| Green | Martin Alan Peek | 439 | 13.61 | |
| Labour | Cid Gibbs | 222 | 6.88 | |
| Majority | 971 | 30.10 | ||
| Turnout | 3226 | 37.61 | ||
| Liberal Democrats hold | ||||
| Party | Candidate | Votes | % | |
|---|---|---|---|---|
| Conservative | Jenny Chamberlin | 1,563 | 57.02 | |
| Liberal Democrats | Trevor Leonard Wenman | 978 | 35.68 | |
| Labour | Andy Barrett | 200 | 7.30 | |
| Majority | 585 | 21.34 | ||
| Turnout | 2741 | 36.53 | ||
| Conservative hold | ||||
| Party | Candidate | Votes | % | |
|---|---|---|---|---|
| Conservative | Martin James Wilby | 1,565 | 51.99 | |
| Liberal Democrats | John Francis Pitt-Pladdy | 1,263 | 41.96 | |
| Labour | Thomas Clennell | 182 | 6.05 | |
| Majority | 302 | 10.03 | ||
| Turnout | 3010 | 41.67 | ||
| Conservative hold | ||||
| Party | Candidate | Votes | % | |
|---|---|---|---|---|
| Conservative | Jon Herbert | 1,769 | 50.27 | |
| Liberal Democrats | Bob McClenning | 1,156 | 32.85 | |
| Green | Roy Arthur Walmsley | 403 | 11.45 | |
| Labour | Tracey Jane Lucy Richardson | 191 | 5.43 | |
| Majority | 613 | 17.42 | ||
| Turnout | 3519 | 44.90 | ||
| Conservative hold | ||||
| Party | Candidate | Votes | % | |
|---|---|---|---|---|
| Conservative | Roger Ackworth Smith | 1,646 | 49.22 | |
| Liberal Democrats | Alistair Barber Miller | 1,032 | 30.86 | |
| Green | Sandra Browne | 422 | 12.62 | |
| Labour | Nicola Jeannette Fowler | 244 | 7.30 | |
| Majority | 614 | 18.36 | ||
| Turnout | 3344 | 47.56 | ||
| Conservative hold | ||||
| Party | Candidate | Votes | % | |
|---|---|---|---|---|
| Conservative | Steve Dorrington | 1,620 | 56.70 | |
| Liberal Democrats | Jeremy Dore | 998 | 34.93 | |
| Labour | Kevin Patrick O'Grady | 239 | 8.37 | |
| Majority | 622 | 21.77 | ||
| Turnout | 2857 | 44.62 | ||
| Conservative hold | ||||
| Party | Candidate | Votes | % | |
|---|---|---|---|---|
| Conservative | Daniel Richard Cox | 1,925 | 51.94 | |
| Liberal Democrats | Jacky Sutton | 911 | 24.58 | |
| Green | Jan Kitchener | 573 | 15.46 | |
| Labour | Marian Chapman | 297 | 8.01 | |
| Majority | 1014 | 27.36 | ||
| Turnout | 3706 | 46.91 | ||
| Conservative hold | ||||
At a by-election on 13 January 2011, the Conservatives retained Humbleyard.
| Party | Candidate | Votes | % | |
|---|---|---|---|---|
| Conservative | Adrian John Gunson | 3,087 | 77.62 | |
| Liberal Democrats | Jane Helen Walker | 481 | 12.09 | |
| Labour | Timothy Michael Sanders | 233 | 5.86 | |
| Independent | Ingo Wagenknecht | 176 | 4.43 | |
| Majority | 2606 | 65.53 | ||
| Turnout | 3977 | 48.80 | ||
| Conservative hold | ||||
| Party | Candidate | Votes | % | |
|---|---|---|---|---|
| Conservative | Alison Mary Thomas | 1,839 | 57.63 | |
| Liberal Democrats | Marian Jean Miller | 1,116 | 34.97 | |
| Labour | Sally Blaikie | 236 | 7.40 | |
| Majority | 723 | 22.66 | ||
| Turnout | 3191 | 42.49 | ||
| Conservative hold | ||||
| Party | Candidate | Votes | % | |
|---|---|---|---|---|
| Conservative | Beverley Herbert Allison Spratt | 2,618 | 64.50 | |
| Liberal Democrats | Bodo Rissman | 1,136 | 27.99 | |
| Labour | Cecila Da Fonseca | 305 | 7.51 | |
| Majority | 1482 | 36.51 | ||
| Turnout | 4059 | 46.87 | ||
| Conservative hold | ||||
| Party | Candidate | Votes | % | |
|---|---|---|---|---|
| Conservative | Joe Mooney | 2,503 | 63.42 | |
| Liberal Democrats | Tim Sutton-Day | 670 | 16.97 | |
| Green | Andrew John Mitchell | 426 | 10.79 | |
| Labour | John Lessels Cowan | 348 | 8.82 | |
| Majority | 1833 | 46.44 | ||
| Turnout | 3947 | 44.33 | ||
| Conservative hold | ||||
References
- "Norfolk council". Andrew Teale. 2009. Retrieved 18 December 2016.
| County council elections |
| ||
|---|---|---|---|
| Mayoral elections |
| ||
| Unitary authorities | |||
| Other English councils |
| ||
| |||