2004 Tandridge District Council election
The 2004 Tandridge District Council election took place on 10 June 2004 to elect members of Tandridge District Council in Surrey, England. One third of the council was up for election and the Conservative party stayed in overall control of the council.[1]
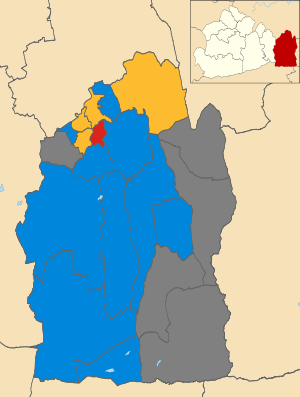
Map of the results of the 2004 Tandridge District Council election. Conservatives in blue, Liberal Democrats in yellow and Labour in red. Wards in grey were not contested in 2004.
After the election, the composition of the council was
- Conservative 28
- Liberal Democrat 11
- Labour 2
- Independent 1[2]
Election result
Overall turnout at the election was 46.25%.[3]
| Party | Seats | Gains | Losses | Net gain/loss | Seats % | Votes % | Votes | +/− | |
|---|---|---|---|---|---|---|---|---|---|
| Conservative | 10 | 1 | 1 | 0 | 66.7 | 50.8 | 11,099 | +1.3% | |
| Liberal Democrats | 4 | 1 | 0 | +1 | 26.7 | 32.2 | 7,038 | -5.5% | |
| Labour | 1 | 0 | 1 | -1 | 6.7 | 8.2 | 1,797 | +1.5% | |
| UKIP | 0 | 0 | 0 | 0 | 0 | 8.8 | 1,921 | +5.4% | |
Ward results
| Party | Candidate | Votes | % | ± | |
|---|---|---|---|---|---|
| Conservative | M Myland | 1,104 | 59.9 | -1.2 | |
| Liberal Democrats | R Fowler | 394 | 21.4 | -9.9 | |
| UKIP | I Crabb | 218 | 11.8 | +11.8 | |
| Labour | P Young | 126 | 6.8 | -0.8 | |
| Majority | 710 | 38.5 | +8.7 | ||
| Turnout | 1,842 | 42.4 | +10.9 | ||
| Conservative hold | Swing | ||||
| Party | Candidate | Votes | % | ± | |
|---|---|---|---|---|---|
| Conservative | R Jones | 962 | 54.3 | -5.2 | |
| Liberal Democrats | J Brock | 412 | 23.3 | -17.2 | |
| UKIP | G Bailey | 397 | 22.4 | +22.4 | |
| Majority | 550 | 31.0 | +12.0 | ||
| Turnout | 1,771 | 41.0 | +12.4 | ||
| Conservative hold | Swing | ||||
| Party | Candidate | Votes | % | ± | |
|---|---|---|---|---|---|
| Conservative | K Harwood | 601 | 75.4 | +4.4 | |
| Liberal Democrats | R O'Brien | 135 | 16.9 | -12.1 | |
| UKIP | D Milne | 61 | 7.7 | +7.7 | |
| Majority | 466 | 58.5 | +16.5 | ||
| Turnout | 797 | 51.9 | +16.9 | ||
| Conservative hold | Swing | ||||
| Party | Candidate | Votes | % | ± | |
|---|---|---|---|---|---|
| Conservative | J Gascoigne | 937 | 48.2 | -4.7 | |
| Liberal Democrats | S Paterson | 593 | 30.5 | -9.5 | |
| UKIP | E Fisher | 282 | 14.5 | +14.5 | |
| Labour | M Mathews | 134 | 6.9 | +0.8 | |
| Majority | 344 | 17.7 | +5.8 | ||
| Turnout | 1,946 | 45.2 | +7.3 | ||
| Conservative hold | Swing | ||||
| Party | Candidate | Votes | % | ± | |
|---|---|---|---|---|---|
| Conservative | M Cooper | 837 | 61.5 | +7.3 | |
| Liberal Democrats | D Martin | 523 | 38.5 | -7.3 | |
| Majority | 314 | 23.0 | +14.6 | ||
| Turnout | 1,360 | 48.5 | +6.6 | ||
| Conservative hold | Swing | ||||
| Party | Candidate | Votes | % | ± | |
|---|---|---|---|---|---|
| Conservative | G Keymer | 1,181 | 57.9 | ||
| Liberal Democrats | M Griffiths | 636 | 31.2 | ||
| UKIP | J Stone | 224 | 11.0 | ||
| Majority | 545 | 26.7 | |||
| Turnout | 2,041 | 50.0 | +9.5 | ||
| Conservative hold | Swing | ||||
| Party | Candidate | Votes | % | ± | |
|---|---|---|---|---|---|
| Conservative | E Parker | 864 | 37.4 | +4.8 | |
| Labour | B Harling | 825 | 35.7 | -5.2 | |
| Liberal Democrats | C Lewis | 330 | 14.3 | -0.7 | |
| UKIP | A Stone | 294 | 12.7 | +1.2 | |
| Majority | 39 | 1.7 | |||
| Turnout | 2,313 | 55.7 | +6.5 | ||
| Conservative gain from Labour | Swing | ||||
| Party | Candidate | Votes | % | ± | |
|---|---|---|---|---|---|
| Liberal Democrats | H Turner | 791 | 60.9 | +2.4 | |
| Conservative | F Bright | 508 | 39.1 | -2.4 | |
| Majority | 283 | 21.8 | +4.8 | ||
| Turnout | 1,299 | 44.9 | +7.9 | ||
| Liberal Democrats hold | Swing | ||||
| Party | Candidate | Votes | % | ± | |
|---|---|---|---|---|---|
| Liberal Democrats | J Orrick | 824 | 53.0 | +6.6 | |
| Conservative | D Hodge | 730 | 47.0 | -1.3 | |
| Majority | 94 | 6.0 | |||
| Turnout | 1,554 | 57.1 | |||
| Liberal Democrats gain from Conservative | Swing | ||||
| Party | Candidate | Votes | % | ± | |
|---|---|---|---|---|---|
| Labour | P Longhurst | 413 | 32.5 | +10.6 | |
| Liberal Democrats | C Daly | 383 | 30.2 | -22.4 | |
| Conservative | N Marks | 340 | 26.8 | +1.3 | |
| UKIP | M Bowes | 133 | 10.5 | +10.5 | |
| Majority | 30 | 2.3 | |||
| Turnout | 1,269 | 46.1 | +7.9 | ||
| Labour hold | Swing | ||||
| Party | Candidate | Votes | % | ± | |
|---|---|---|---|---|---|
| Liberal Democrats | J Pursehouse | 675 | 38.5 | -12.8 | |
| Conservative | D Cooley | 648 | 37.0 | +1.9 | |
| UKIP | M Haley | 312 | 17.8 | +4.2 | |
| Labour | B Garwood | 118 | 6.7 | +6.7 | |
| Majority | 27 | 1.5 | -14.7 | ||
| Turnout | 1,753 | 43.7 | +8.6 | ||
| Liberal Democrats hold | Swing | ||||
| Party | Candidate | Votes | % | ± | |
|---|---|---|---|---|---|
| Conservative | R Allen | 824 | 69.7 | +1.6 | |
| Liberal Democrats | R James | 358 | 30.3 | +3.6 | |
| Majority | 466 | 39.4 | -2.0 | ||
| Turnout | 1,182 | 46.2 | |||
| Conservative hold | Swing | ||||
| Party | Candidate | Votes | % | ± | |
|---|---|---|---|---|---|
| Conservative | S Altria | 521 | 55.8 | +5.5 | |
| Liberal Democrats | D Gosling | 232 | 24.8 | +11.4 | |
| Labour | R Clements | 181 | 19.4 | -16.9 | |
| Majority | 289 | 31.0 | +17.0 | ||
| Turnout | 934 | 34.5 | |||
| Conservative hold | Swing | ||||
| Party | Candidate | Votes | % | ± | |
|---|---|---|---|---|---|
| Liberal Democrats | J Gray | 627 | 64.6 | +8.1 | |
| Conservative | M Frankcom | 343 | 35.4 | -2.3 | |
| Majority | 284 | 29.2 | +10.4 | ||
| Turnout | 970 | 37.9 | |||
| Liberal Democrats hold | Swing | ||||
| Party | Candidate | Votes | % | ± | |
|---|---|---|---|---|---|
| Conservative | R Butcher | 699 | 84.8 | ||
| Liberal Democrats | L Martin | 125 | 15.2 | ||
| Majority | 574 | 69.6 | |||
| Turnout | 824 | 55.3 | |||
| Conservative hold | Swing | ||||
By-elections between 2004 and 2006
Chaldon
| Party | Candidate | Votes | % | ± | |
|---|---|---|---|---|---|
| Conservative | Christina Fry | 622 | 63.1 | -5.7 | |
| Liberal Democrats | Catherine Tomlin | 363 | 36.9 | +5.7 | |
| Majority | 259 | 26.2 | -11.4 | ||
| Turnout | 985 | 71.2 | +33.5 | ||
| Conservative hold | Swing | ||||
Limpsfield
| Party | Candidate | Votes | % | ± | |
|---|---|---|---|---|---|
| Conservative | Colin Walker | 1,271 | 64.5 | +4.3 | |
| Liberal Democrats | Mark Wilson | 699 | 35.5 | +0.1 | |
| Majority | 572 | 29.0 | +4.2 | ||
| Turnout | 1,970 | 73.3 | +31.7 | ||
| Conservative hold | Swing | ||||
gollark: It's fine.
gollark: Odd.
gollark: ++remind 7979y end of end of time
gollark: ++remind 7978y end of time
gollark: ++magic py 7978 + 2021
References
- "Tandridge council". BBC News Online. 11 June 2004. Retrieved 5 January 2012.
- "How the southeast voted in the District Council polls". Evening Standard. 11 June 2004. p. 9.
- "Candidates by ward - District Council Elections June 10, 2004" (PDF). Political Science Resources. Retrieved 5 January 2012.
- "Ballot box". The Times. 12 June 2004. p. 26.
- "Tandridge District Council By-elections 5 May 2005" (PDF). Tandridge District Council. Archived from the original (PDF) on 23 December 2005. Retrieved 8 March 2015.
This article is issued from Wikipedia. The text is licensed under Creative Commons - Attribution - Sharealike. Additional terms may apply for the media files.