1999 Waterford City Council election
An election to Waterford City Council took place on 10 June 1999 as part of that year's Irish local elections. 15 councillors were elected from three electoral divisions by PR-STV voting for a five-year term of office.
| |||||||||||||||||||||||||||||||||||||
All 15 seats to Waterford City Council | |||||||||||||||||||||||||||||||||||||
|---|---|---|---|---|---|---|---|---|---|---|---|---|---|---|---|---|---|---|---|---|---|---|---|---|---|---|---|---|---|---|---|---|---|---|---|---|---|
| |||||||||||||||||||||||||||||||||||||
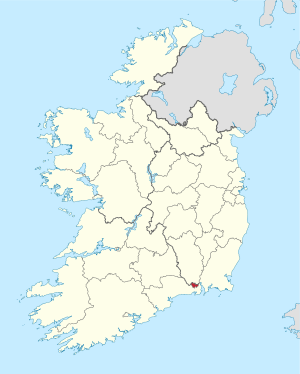 Map showing the area of Waterford City Council | |||||||||||||||||||||||||||||||||||||
| |||||||||||||||||||||||||||||||||||||
Results by party
| Party | Seats | ± | First Pref. votes | FPv% | ±% | |
|---|---|---|---|---|---|---|
| Fianna Fáil | 4 | +1 | 2,679 | 20.39% | ||
| Fine Gael | 3 | +1 | 2,708 | 20.61% | ||
| Workers' Party | 3 | - | 2,210 | 16.82% | ||
| Labour Party | 2 | -1 | 1,804 | 13.73% | ||
| Progressive Democrats | 1 | -1 | 504 | 3.84% | ||
| Independent | 2 | - | 2,785 | 21.19% | ||
| Totals | 15 | - | 13,142 | 100% | — | |
Results by Electoral Area
Waterford No.1
| Waterford No.1 - 4 seats | ||||||||||
|---|---|---|---|---|---|---|---|---|---|---|
| Party | Candidate | FPv% | Count 1 | Count 2 | Count 3 | Count 4 | Count 5 | Count 6 | ||
| Labour Party | Pat Hayes* | 22.70 | 847 | |||||||
| Fine Gael | Hilary Quinlan* | 21.98 | 820 | |||||||
| Independent | Michael Duffy | 14.77 | 551 | 573 | 593 | 617 | 629 | 659 | ||
| Fianna Fáil | Sean Dower | 13.32 | 497 | 521 | 524 | 537 | 541 | 762 | ||
| Workers' Party | Davy Walsh* | 13.21 | 493 | 521 | 547 | 567 | 669 | 709 | ||
| Fianna Fáil | Larry Dower* | 8.58 | 320 | 331 | 333 | 343 | 357 | |||
| Workers' Party | Jimmy Houlihan | 3.67 | 137 | 147 | 158 | 164 | ||||
| Green Party | Ben Nutty | 1.77 | 66 | 71 | ||||||
| Electorate: 7,941 Valid: 3,731 (46.98%) Spoilt: 66 Quota: 747 Turnout: 3,797 (47.82%) | ||||||||||
Waterford No.2
| Waterford No.2 - 5 seats | ||||||||||||
|---|---|---|---|---|---|---|---|---|---|---|---|---|
| Party | Candidate | FPv% | Count 1 | Count 2 | Count 3 | Count 4 | Count 5 | Count 6 | Count 7 | Count 8 | ||
| Independent | Davy Daniels* | 31.45 | 1,523 | |||||||||
| Fianna Fáil | Michael Ivory | 10.76 | 521 | 657 | 660 | 668 | 688 | 709 | 744 | 784 | ||
| Progressive Democrats | Oliver Clery | 10.41 | 504 | 609 | 612 | 621 | 651 | 685 | 735 | 786 | ||
| Fine Gael | Tom Cunningham* | 10.12 | 490 | 584 | 586 | 594 | 676 | 780 | 829 | |||
| Fianna Fáil | Mary Roche | 8.57 | 415 | 502 | 507 | 530 | 552 | 593 | 648 | 719 | ||
| Green Party | Brendan McCann | 5.68 | 275 | 334 | 353 | 395 | 409 | 446 | 504 | 636 | ||
| Labour Party | Christine O'Dowd-Smith | 5.39 | 261 | 302 | 315 | 352 | 359 | 387 | 406 | |||
| Independent | Seán Rohan | 4.81 | 233 | 287 | 291 | 306 | 316 | 331 | ||||
| Fine Gael | Mary Darlington | 4.54 | 220 | 270 | 275 | 282 | 313 | |||||
| Fine Gael | John Carey | 3.49 | 169 | 224 | 232 | 239 | ||||||
| Workers' Party | Olga Redmond-Stokes | 2.85 | 138 | 155 | 186 | |||||||
| Socialist Workers | Carolann Duggan | 1.92 | 93 | 110 | ||||||||
| Electorate: 11,302 Valid: 4,842 (42.84%) Spoilt: 50 Quota: 808 Turnout: 4,892 (43.28%) | ||||||||||||
Waterford No.3
| Waterford No.3 - 6 seats | ||||||||||||
|---|---|---|---|---|---|---|---|---|---|---|---|---|
| Party | Candidate | FPv% | Count 1 | Count 2 | Count 3 | Count 4 | Count 5 | Count 6 | Count 7 | Count 8 | ||
| Workers' Party | Martin O'Regan* | 18.96 | 884 | |||||||||
| Fine Gael | Maurice Cummins* | 16.62 | 775 | |||||||||
| Fianna Fáil | Tom Murphy | 12.42 | 579 | 605 | 616 | 633 | 644 | 651 | 672 | |||
| Labour Party | Seamus Ryan | 11.52 | 537 | 558 | 570 | 585 | 600 | 616 | 689 | |||
| Workers' Party | John Halligan | 9.18 | 428 | 496 | 507 | 514 | 542 | 642 | 677 | |||
| Fianna Fáil | Chuck O'Connell | 7.44 | 347 | 354 | 359 | 373 | 380 | 389 | 404 | 458 | ||
| Independent | Laurence (Cha) O'Neill | 7.40 | 345 | 357 | 370 | 381 | 400 | 409 | 424 | 502 | ||
| Fine Gael | Michelle O'Neill | 5.02 | 234 | 244 | 277 | 283 | 287 | 301 | 325 | |||
| Labour Party | Sue Larkin | 3.41 | 159 | 170 | 177 | 198 | 214 | 231 | ||||
| Socialist Workers | James Kelly | 2.85 | 133 | 144 | 148 | 151 | ||||||
| Workers' Party | Billy McCarthy | 2.79 | 130 | 175 | 180 | 187 | 213 | |||||
| Green Party | Catherine Kinsella | 2.38 | 111 | 117 | 124 | |||||||
| Electorate: 10,799 Valid: 4,662 (43.17%) Spoilt: 100 Quota: 667 Turnout: 4,762 (44.10%) | ||||||||||||
gollark: My phone has an accurate firecubez emulator.
gollark: Is Macron GCed?
gollark: Anyway, Macron 3.3 is to he deployrdjwnw.
gollark: * beeated
gollark: If you just arbitrarily split it mid character or something it could be berated.
External links
| Preceded by 1991 Waterford City Council election |
Waterford City Council elections | Succeeded by 2004 Waterford City Council election |
This article is issued from Wikipedia. The text is licensed under Creative Commons - Attribution - Sharealike. Additional terms may apply for the media files.