1997 United Kingdom general election in England
The 1997 United Kingdom general election in England was held on 1 May 1997 for 529 English seats to the House of Commons. Under Tony Blair, the Labour Party won a landslide majority of English seats, the first time since 1966 that Labour had won an overall majority of English seats.[2] The England result, together with even larger landslide Labour results in Scotland and Wales, gave Labour the biggest majority for any single party since 1931. Blair subsequently formed the first Labour government since 1979, beginning 13 years of Labour government.
| |||||||||||||||||||||||||||||||||||||||||||||||||
All 529 English seats to the House of Commons | |||||||||||||||||||||||||||||||||||||||||||||||||
|---|---|---|---|---|---|---|---|---|---|---|---|---|---|---|---|---|---|---|---|---|---|---|---|---|---|---|---|---|---|---|---|---|---|---|---|---|---|---|---|---|---|---|---|---|---|---|---|---|---|
| |||||||||||||||||||||||||||||||||||||||||||||||||
†Notional 1992 results if held on the 1997 boundaries *Indicates boundary change - so this is a notional figure. | |||||||||||||||||||||||||||||||||||||||||||||||||
Results table
| Party[3] | Seats | Votes | |||||||
|---|---|---|---|---|---|---|---|---|---|
| Total | Gains | Losses | Net +/- | % seats | Total votes | % votes | Change | ||
| Labour | 328 | 133 | 1 | 62.0 | 11,347,882 | 43.5 | |||
| Conservative | 165 | 0 | 159 | 31.2 | 8,780,881 | 33.7 | |||
| Liberal Democrats | 34 | 26 | 1 | 6.4 | 4,677,565 | 18.0 | |||
| Referendum | 0 | 0 | 0 | — | 746,624 | 2.9 | N/A | ||
| UKIP | 0 | 0 | 0 | — | 103,521 | 0.4 | N/A | ||
| Independent | 1 | 1 | 0 | 0.2 | 69,464 | 0.3 | |||
| Green | 0 | 0 | 0 | — | 60,013 | 0.2 | |||
| Liberal | 0 | 0 | 0 | — | 44,516 | 0.2 | |||
| Socialist Labour | 0 | 0 | 0 | — | 44,114 | 0.2 | N/A | ||
| BNP | 0 | 0 | 0 | — | 35,181 | 0.1 | |||
| Natural Law | 0 | 0 | 0 | — | 25,958 | 0.1 | |||
| Independent Labour | 0 | 0 | 0 | — | 24,447 | 0.1 | |||
| Speaker | 1 | 1 | 0 | 0.2 | 24,447 | 0.1 | N/A | ||
| Ind. Conservative | 0 | 0 | 0 | — | 18,667 | 0.1 | |||
| Prolife Alliance | 0 | 0 | 0 | — | 13,890 | 0.1 | N/A | ||
| Other parties | 0 | 0 | 0 | — | 42,020 | 0.2 | N/A | ||
| 26,058,712 | 71.5 | ||||||||
Regional results
Regional vote shares and changes are sourced from the House of Commons Library.[4]
North East
| Party | Seats | Votes | ||||||
|---|---|---|---|---|---|---|---|---|
| Total | Gained | Lost | Net | Total | % | Change (%) | ||
| Labour | 28 | +3 | 862,262 | 64.0 | +10.7 | |||
| Conservative | 1 | -3 | 266,294 | 19.8 | -11.0 | |||
| Liberal Democrats | 1 | 169,270 | 12.6 | -2.9 | ||||
| Others | 0 | 48,764 | 3.6 | — | ||||
| Total | 30 | Turnout | 1,346,590 | |||||
North West
| Party | Seats | Votes | ||||||
|---|---|---|---|---|---|---|---|---|
| Total | Gained | Lost | Net | Total | % | Change (%) | ||
| Labour | 49 | +13 | 1,499,518 | 51.5 | +9.0 | |||
| Conservative | 9 | -14 | 859,436 | 29.5 | -11.3 | |||
| Liberal Democrats | 1 | 421,025 | 14.5 | -1.0 | ||||
| Others | 1 | +1 | 130,730 | 4.5 | — | |||
| Total | 60 | Turnout | 2,910,709 | |||||
Merseyside
| Party | Seats | Votes | ||||||
|---|---|---|---|---|---|---|---|---|
| Total | Gained | Lost | Net | Total | % | Change (%) | ||
| Labour | 15 | +3 | 442,366 | 64.0 | +10.4 | |||
| Conservative | 0 | -4 | 141,120 | 19.8 | -9.3 | |||
| Liberal Democrats | 1 | +1 | 103,152 | 12.6 | -2.4 | |||
| Others | 0 | 28,158 | 3.6 | — | ||||
| Total | 16 | Turnout | 714,796 | |||||
Yorkshire and the Humber
| Party | Seats | Votes | ||||||
|---|---|---|---|---|---|---|---|---|
| Total | Gained | Lost | Net | Total | % | Change (%) | ||
| Labour | 47 | +13 | 1,339,170 | 51.9 | +7.6 | |||
| Conservative | 7 | -15 | 720,771 | 28.0 | -10.0 | |||
| Liberal Democrats | 2 | +2 | 412,216 | 16.0 | -0.8 | |||
| Others | 0 | 106,016 | 4.1 | — | ||||
| Total | 56 | Turnout | 2,578,173 | |||||
East Midlands
| Party | Seats | Votes | ||||||
|---|---|---|---|---|---|---|---|---|
| Total | Gained | Lost | Net | Total | % | Change (%) | ||
| Labour | 30 | +15 | 1,097,639 | 47.8 | +10.4 | |||
| Conservative | 14 | -15 | 800,958 | 34.9 | -11.7 | |||
| Liberal Democrats | 0 | 311,264 | 13.6 | -1.7 | ||||
| Others | 0 | 84,889 | 3.7 | — | ||||
| Total | 44 | Turnout | 2,294,750 | |||||
West Midlands
| Party | Seats | Votes | ||||||
|---|---|---|---|---|---|---|---|---|
| Total | Gained | Lost | Net | Total | % | Change (%) | ||
| Labour | 43 | +15 | 1,326,822 | 47.0 | +8.2 | |||
| Conservative | 14 | -17 | 953,465 | 33.7 | -11.0 | |||
| Liberal Democrats | 1 | +1 | 388,807 | 13.8 | -1.3 | |||
| Others | 1 | +1 | 156,731 | 5.5 | — | |||
| Total | 59 | Turnout | 2,825,825 | |||||
East of England
| Party | Seats | Votes | ||||||
|---|---|---|---|---|---|---|---|---|
| Total | Gained | Lost | Net | Total | % | Change (%) | ||
| Conservative | 33 | -19 | 1,164,777 | 39.5 | -13.0 | |||
| Labour | 22 | +18 | 1,137,637 | 38.6 | +12.2 | |||
| Liberal Democrats | 1 | +1 | 504,416 | 17.1 | -2.7 | |||
| Others | 0 | 140,337 | 4.8 | — | ||||
| Total | 56 | Turnout | 2,947,167 | |||||
London
| Party | Seats | Votes | ||||||
|---|---|---|---|---|---|---|---|---|
| Total | Gained | Lost | Net | Total | % | Change (%) | ||
| Labour | 57 | +25 | 1,643,329 | 49.5 | +12.4 | |||
| Conservative | 11 | -30 | 1,036,082 | 31.2 | -14.1 | |||
| Liberal Democrats | 6 | +5 | 485,511 | 14.6 | -1.3 | |||
| Others | 0 | 156,126 | 4.7 | — | ||||
| Total | 74 | Turnout | 3,321,048 | |||||
South East
| Party | Seats | Votes | ||||||
|---|---|---|---|---|---|---|---|---|
| Total | Gained | Lost | Net | Total | % | Change (%) | ||
| Conservative | 54 | -25 | 1,817,343 | 41.9 | -13.1 | |||
| Labour | 22 | +18 | 1,264,778 | 29.1 | +10.2 | |||
| Liberal Democrats | 7 | +7 | 1,012,418 | 23.3 | -1.4 | |||
| Others | 0 | 247,069 | 5.7 | — | ||||
| Total | 83 | Turnout | 4,341,608 | |||||
South West
| Party | Seats | Votes | ||||||
|---|---|---|---|---|---|---|---|---|
| Total | Gained | Lost | Net | Total | % | Change (%) | ||
| Conservative | 22 | -17 | 1,020,635 | 36.7 | -10.8 | |||
| Liberal Democrats | 14 | +8 | 869,486 | 31.3 | -0.1 | |||
| Labour | 15 | +9 | 734,361 | 26.4 | +7.2 | |||
| Others | 0 | 153,564 | 5.5 | — | ||||
| Total | 51 | Turnout | 2,778,046 | |||||
gollark: Zoey, have YOU seen the glory of quick sort.c?
gollark: You need to escape those *s.
gollark: I should really have improved quick sort.c with the gibson style guide.
gollark: Ah, well, quick sort.c produces *no* warnings in that.
gollark: Yes.
See also
Notes
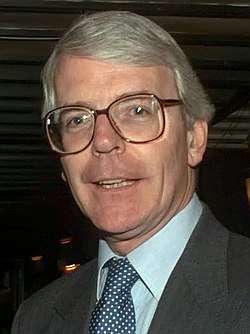
- Conservative party leader John Major resigned as Leader of the Conservative Party on 22 June 1995 to face critics in his party and government, and was reelected as Leader on 4 July 1995. Prior to his resignation he had held the post of Leader of the Conservative Party since 28 November 1990.[1]
References
- "1995: Major wins Conservative leadership". BBC News. 4 July 1995.
- "General election results 1 May 1997". 9 May 1997. Retrieved 22 July 2018.
- "General election results 1 May 1997". 9 May 1997. Retrieved 22 July 2018.
- https://www.parliament.uk/documents/commons-information-office/m15.pdf
This article is issued from Wikipedia. The text is licensed under Creative Commons - Attribution - Sharealike. Additional terms may apply for the media files.
.jpg)

