1991 Westmeath County Council election
An election to Westmeath County Council took place on 27 June 1991 as part of that year's Irish local elections. 23 councillors were elected from five electoral divisions by PR-STV voting for an eight-year term of office.
| |||||||||||||||||||||||||||||||||
All 23 seats to Westmeath County Council | |||||||||||||||||||||||||||||||||
|---|---|---|---|---|---|---|---|---|---|---|---|---|---|---|---|---|---|---|---|---|---|---|---|---|---|---|---|---|---|---|---|---|---|
| |||||||||||||||||||||||||||||||||
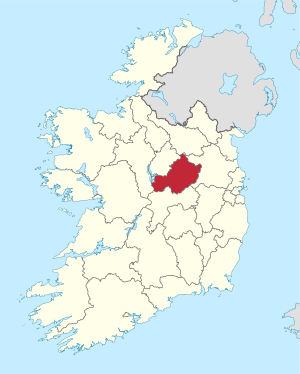 Map showing the area of Westmeath County Council | |||||||||||||||||||||||||||||||||
| |||||||||||||||||||||||||||||||||
Results by party
| Party | Seats | ± | First Pref. votes | FPv% | ±% | |
|---|---|---|---|---|---|---|
| Fianna Fáil | 12 | -1 | 12,247 | 44.26% | ||
| Fine Gael | 6 | +1 | 7,561 | 27.33% | ||
| Labour Party | 4 | +1 | 5,063 | 18.3% | ||
| Independent | 1 | -1 | 2,415 | 8.7% | ||
| Totals | 23 | - | 27,670 | 100% | — | |
Results by Electoral Area
Athlone
| Athlone - 7 seats | ||||||||||||||||||||
|---|---|---|---|---|---|---|---|---|---|---|---|---|---|---|---|---|---|---|---|---|
| Party | Candidate | FPv% | Count 1 | Count 2 | Count 3 | Count 4 | Count 5 | Count 6 | Count 7 | Count 8 | Count 9 | Count 10 | Count 11 | Count 12 | Count 13 | Count 14 | Count 15 | Count 16 | ||
| Fianna Fáil | Senator Seán Fallon* | 13% | 1,140 | |||||||||||||||||
| Fine Gael | Brendan McFadden* | 9.3% | 817 | 821 | 831 | 839 | 860 | 906 | 962 | 988 | 1,064 | 1,070 | 1,180 | |||||||
| Fianna Fáil | P.J. Coghill* | 8.4% | 737 | 740 | 742 | 746 | 753 | 758 | 762 | 764 | 834 | 882 | 896 | 897 | 912 | 932 | 940 | 981 | ||
| Independent | Stephen Price* | 7.9% | 693 | 694 | 713 | 719 | 729 | 736 | 742 | 778 | 792 | 931 | 952 | 956 | 1,009 | 1,228 | ||||
| Fianna Fáil | Kieran Molloy | 7.5% | 660 | 668 | 671 | 684 | 701 | 707 | 734 | 766 | 774 | 812 | 846 | 857 | 943 | 959 | 966 | 1,033 | ||
| Fianna Fáil | Kieran Temple* | 6.5% | 575 | 582 | 583 | 590 | 600 | 621 | 629 | 641 | 647 | 672 | 712 | 729 | 764 | 774 | 782 | 826 | ||
| Fianna Fáil | Egbert Moran | 5.3% | 463 | 467 | 469 | 477 | 480 | 510 | 517 | 522 | 531 | 591 | 643 | 648 | 662 | 675 | 680 | 782 | ||
| Fine Gael | George Allen* | 4.7% | 415 | 416 | 423 | 424 | 435 | 477 | 480 | 484 | 537 | 581 | 636 | 652 | 664 | 837 | 895 | 998 | ||
| Fianna Fáil | George Ledwidth* | 4.5% | 399 | 401 | 407 | 408 | 414 | 416 | 419 | 425 | 432 | |||||||||
| Fine Gael | Pauline Coghlan | 4.3% | 381 | 382 | 392 | 393 | 394 | 417 | 417 | 422 | 486 | 525 | 545 | 558 | 567 | |||||
| Labour Party | John Henson | 4.3% | 377 | 379 | 400 | 410 | 427 | 441 | 507 | 533 | 555 | 563 | 587 | 594 | 646 | 670 | 673 | |||
| Progressive Democrats | Des Lynch | 4.1% | 364 | 365 | 367 | 372 | 377 | 402 | 412 | 425 | 437 | 445 | ||||||||
| Fine Gael | Vincent Dooley | 3.8% | 332 | 333 | 336 | 337 | 352 | 367 | 371 | 379 | ||||||||||
| Independent | Patsy Beaumont | 2.9% | 255 | 257 | 263 | 282 | 327 | 330 | 363 | 450 | 460 | 462 | 484 | 491 | ||||||
| Fine Gael | Dick O'Brien | 2.7% | 241 | 243 | 244 | 246 | ||||||||||||||
| Independent | Austin Berry | 2.7% | 234 | 235 | 245 | 285 | 321 | 324 | 337 | |||||||||||
| Labour Party | John Keenehan | 2.6% | 230 | 231 | 237 | 244 | 250 | 250 | ||||||||||||
| Independent | Oliver Gavin | 2.4% | 209 | 210 | 217 | 226 | ||||||||||||||
| Independent | John Kearney | 1.6% | 144 | 145 | 147 | |||||||||||||||
| Labour Party | David Dolan | 0.9% | 82 | 82 | ||||||||||||||||
| Independent | Benny Cooney | 0.5% | 43 | 43 | ||||||||||||||||
| Electorate: 15,813 Valid: 8,790 (55.59%) Spoilt: 71 Quota: 1,099 Turnout: 8,861 (56.04%) | ||||||||||||||||||||
Coole
| Coole - 4 seats | |||||||||||
|---|---|---|---|---|---|---|---|---|---|---|---|
| Party | Candidate | FPv% | Count 1 | Count 2 | Count 3 | Count 4 | Count 5 | Count 6 | Count 7 | ||
| Fianna Fáil | Senator Donie Cassidy* | 18.3% | 897 | 921 | 933 | 1,021 | |||||
| Fianna Fáil | P.J. O'Shaughnessy* | 14.7% | 720 | 725 | 731 | 816 | 857 | 880 | 1,000 | ||
| Fianna Fáil | Thomas Bourke* | 12.8% | 628 | 630 | 714 | 753 | 768 | 870 | 878 | ||
| Fine Gael | Frank McDermott* | 12.1% | 594 | 617 | 644 | 702 | 728 | 764 | 1,007 | ||
| Fine Gael | Phil Brennan | 10.3% | 504 | 507 | 561 | 578 | 580 | 672 | 748 | ||
| Fine Gael | Maura Drum | 8.7% | 429 | 435 | 443 | 466 | 470 | 493 | |||
| Labour Party | Johnnie Penrose | 7.8% | 381 | 421 | 463 | 469 | 470 | ||||
| Fianna Fáil | Molly Cahill | 7.6% | 372 | 385 | 391 | ||||||
| Independent | Kevin Boyhan | 5.2% | 255 | 258 | |||||||
| Labour Party | Johnny McCormack | 2.5% | 125 | ||||||||
| Electorate: 7,178 Valid: 4,905 (68.33%) Spoilt: 45 Quota: 982 Turnout: 4,950 (68.96%) | |||||||||||
Kilbeggan
| Kilbeggan - 4 seats | |||||||||||
|---|---|---|---|---|---|---|---|---|---|---|---|
| Party | Candidate | FPv% | Count 1 | Count 2 | Count 3 | Count 4 | Count 5 | Count 6 | Count 7 | ||
| Fine Gael | Joe Flanagan* | 23.2% | 1,124 | ||||||||
| Fianna Fáil | Tom Cowley | 17.3% | 837 | 841 | 925 | 942 | 1,163 | ||||
| Labour Party | Mark Nugent* | 16.9% | 820 | 832 | 874 | 954 | 1,188 | ||||
| Fianna Fáil | Michael Ryan* | 13.6% | 659 | 705 | 718 | 724 | 815 | 866 | 1,043 | ||
| Fianna Fáil | Christo Bradley | 10.9% | 529 | 536 | 547 | 593 | |||||
| Fine Gael | Mary Fallon | 7% | 340 | 397 | 440 | 630 | 644 | 678 | 682 | ||
| Fine Gael | Mary Henry | 7% | 321 | 345 | 360 | ||||||
| Fine Gael | Gerald Cooney | 4.5% | 218 | 222 | |||||||
| Electorate: 7,331 Valid: 4,848 (66.13%) Spoilt: 54 Quota: 970 Turnout: 4,902 (66.87%) | |||||||||||
Mullingar Lough Owel
| Mullingar Lough Owel - 4 seats | |||||||||||
|---|---|---|---|---|---|---|---|---|---|---|---|
| Party | Candidate | FPv% | Count 1 | Count 2 | Count 3 | Count 4 | Count 5 | Count 6 | Count 7 | ||
| Labour Party | Willie Penrose* | 24.1% | 1,170 | ||||||||
| Fianna Fáil | Henry Abbott* | 22.6% | 1,101 | ||||||||
| Fine Gael | John Keegan | 16.9% | 821 | 854 | 864 | 909 | 978 | ||||
| Fianna Fáil | Tommy Wright | 12.1% | 587 | 619 | 654 | 689 | 700 | 700 | 1,043 | ||
| Fianna Fáil | Shay Callaghan* | 9.1% | 444 | 470 | 527 | 568 | 574 | 574 | |||
| Fine Gael | Frank Wallace | 7.6% | 371 | 424 | 440 | 455 | 574 | 579 | 624 | ||
| Fine Gael | Tommy Moughty | 4.3% | 210 | 239 | 243 | 247 | |||||
| Independent | Robert Bagnall | 3.3% | 160 | 184 | 190 | ||||||
| Electorate: 8,054 Valid: 4,864 (60.39%) Spoilt: 40 Quota: 973 Turnout: 4,904 (60.89%) | |||||||||||
Mullingar Urban
| Mullingar Urban - 4 seats | ||||||||||||
|---|---|---|---|---|---|---|---|---|---|---|---|---|
| Party | Candidate | FPv% | Count 1 | Count 2 | Count 3 | Count 4 | Count 5 | Count 6 | Count 7 | Count 8 | ||
| Labour Party | Mick Dollard* | 39.6% | 1,688 | |||||||||
| Fianna Fáil | Camillus Glynn* | 14.1% | 603 | 674 | 674 | 679 | 700 | 714 | 764 | 874 | ||
| Fine Gael | Paul McGrathTD | 12.1% | 517 | 578 | 578 | 579 | 615 | 695 | 747 | 836 | ||
| Fianna Fáil | Martin Hynes* | 11.8% | 501 | 553 | 554 | 555 | 565 | 576 | 623 | 719 | ||
| Fianna Fáil | Jim Bourke | 6.5% | 275 | 304 | 304 | 304 | 328 | 349 | 372 | |||
| Labour Party | Des Coleman* | 4.5% | 190 | 678 | 679 | 689 | 710 | 732 | 810 | 845 | ||
| Independent | Frank McIntyre* | 4.3% | 183 | 266 | 268 | 272 | 290 | 307 | ||||
| Fine Gael | Jim Guinan | 3.4% | 144 | 160 | 161 | 164 | 177 | |||||
| Progressive Democrats | Pat Whelan | 3.3% | 141 | 160 | 160 | 163 | ||||||
| Workers' Party | Patrick Boyce | 0.4% | 19 | 30 | 31 | |||||||
| Independent | Benedict Cooney | 0% | 2 | 7 | ||||||||
| Electorate: 11,119 Valid: 5,731 (51.54%) Spoilt: 78 Quota: 956 Turnout: 5,809 (52.24%) | ||||||||||||
gollark: vs the... is it "Thad"?... light nanoseconds.
gollark: Steamport, if you're in chorus city you can check out the furnace machine.
gollark: That's a higher temperature than a thing at high temperature.
gollark: The potatodatacentre is offline but we still have the computers.
gollark: Only a few hundred.
External links
| Preceded by 1985 Westmeath County Council election |
Westmeath County Council elections | Succeeded by 1999 Westmeath County Council election |
This article is issued from Wikipedia. The text is licensed under Creative Commons - Attribution - Sharealike. Additional terms may apply for the media files.