1981–82 South Pacific cyclone season
The 1981–82 South Pacific cyclone season was a slightly-below average South Pacific tropical cyclone season, with 6 tropical cyclones occurring within the South Pacific Ocean basin between 160°E and 120°W during the season. After this season, the names Gyan and Isaac were retired from the lists of names, after they caused significant impacts to South Pacific island nations.
| 1981–82 South Pacific cyclone season | |
|---|---|
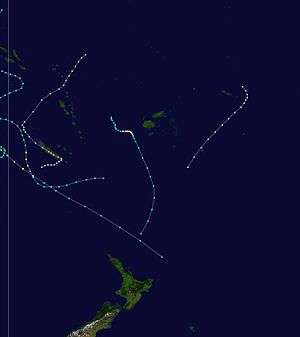 Season summary map | |
| Seasonal boundaries | |
| First system formed | December 18, 1981 |
| Last system dissipated | May 18, 1982 |
| Strongest storm | |
| Name | Gyan |
| • Maximum winds | 185 km/h (115 mph) (10-minute sustained) |
| • Lowest pressure | 925 hPa (mbar) |
| Seasonal statistics | |
| Total depressions | 6 |
| Tropical cyclones | 6 |
| Severe tropical cyclones | 5 |
| Total fatalities | 6 |
| Total damage | Unknown |
| Related articles | |
During the season, tropical cyclones were monitored by the Tropical Cyclone Warning Centers in Nadi, Fiji, Brisbane, Australia and Wellington, New Zealand. During the season TCWC Nadi issued warnings and assigned names to any tropical cyclones that developed between the Equator and 25°S while TCWC Wellington issued warnings for any that were located to the south of 25°S. The United States Armed Forces through the Joint Typhoon Warning Center (JTWC) and Naval Pacific Meteorology and Oceanography Center (NPMOC), also monitored the basin and issued unofficial warnings for American interests. TCWC Nadi, Brisbane and Wellington measured sustained windspeeds over a 10-minute which are compared to the modern day Australian tropical cyclone intensity scale. The JTWC and the NPMOC measured sustained windspeeds over a 1-minute period which are compared to the Saffir-Simpson Hurricane Scale (SSHS).
Systems
Severe Tropical Cyclone Gyan
| Category 4 severe tropical cyclone (Australian scale) | |
| Category 3 tropical cyclone (SSHWS) | |
  | |
| Duration | December 18 – December 29 |
|---|---|
| Peak intensity | 185 km/h (115 mph) (10-min) 925 hPa (mbar) |
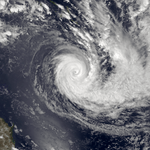
Severe Tropical Cyclone Gyan existed from December 18 to December 29.
Severe Tropical Cyclone Hettie
| Category 3 severe tropical cyclone (Australian scale) | |
| Category 1 tropical cyclone (SSHWS) | |
  | |
| Duration | January 24 – February 1 |
|---|---|
| Peak intensity | 130 km/h (80 mph) (10-min) 965 hPa (mbar) |
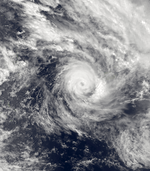
Severe Tropical Cyclone Hettie existed from January 24 to February 1.
Severe Tropical Cyclone Abigail
| Category 4 severe tropical cyclone (Australian scale) | |
| Category 3 tropical cyclone (SSHWS) | |
  | |
| Duration | February 1 – February 7 |
|---|---|
| Peak intensity | 175 km/h (110 mph) (10-min) 947 hPa (mbar) |
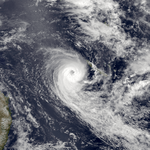
Severe Tropical Cyclone Abigail existed from February 1 to February 7.
Severe Tropical Cyclone Isaac
| Category 4 severe tropical cyclone (Australian scale) | |
| Category 4 tropical cyclone (SSHWS) | |
  | |
| Duration | February 27 – March 5 |
|---|---|
| Peak intensity | 175 km/h (110 mph) (10-min) 930 hPa (mbar) |
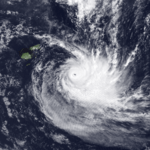
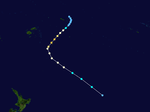
The tropical cyclone developed 160 km/100 mi northeast of western Samoa and travelled southwest at 12 knots, moving through the Ha'apai island group and only 50 km/30 mi northwest of Tongatapu. The pressure at Tongatapu fell to 976.4 mbar (28.83 inHg). Winds of 92 knots were measured at Nuku'alofa,[1] and rainfall of 120 millimetres (4.7 in) was measured there. Isaac reached maximum intensity on March 2. The tropical cyclone was the worst storm in Tonga's history, devastating the island group.[2] The island groups of Ha'apai and Vava'u were hit worst. Six were killed,[1] while 45,000 became homeless and 95% of the livestock was killed.[3] The island of Tatafa was bisected by a 16 metres (52 ft) wide channel caused by Isaac's storm surge.[4]
Severe Tropical Cyclone Bernie
| Category 4 severe tropical cyclone (Australian scale) | |
| Category 2 tropical cyclone (SSHWS) | |
  | |
| Duration | April 5 – April 9 |
|---|---|
| Peak intensity | 165 km/h (105 mph) (10-min) 960 hPa (mbar) |
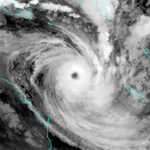
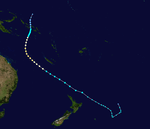
Severe Tropical Cyclone Bernie existed from April 1 to April 9.
Bernie caused extensive damage to natural vegetation and food gardens on the islands of Western Gudalcanal, Santa Isabel, New Georgia and the Russell Islands.[5][6] Over 1000 people also had to evacuated from villages on the eastern coast of Gudalcanal.[5][6]
Tropical Cyclone Claudia
| Category 1 tropical cyclone (Australian scale) | |
| Tropical storm (SSHWS) | |
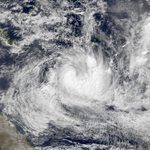  | |
| Duration | May 13 – May 18 |
|---|---|
| Peak intensity | 75 km/h (45 mph) (10-min) 990 hPa (mbar) |
Tropical Cyclone Claudia existed from May 13 to May 18.
Other systems
Between February 4 - 5, a developing tropical cyclone existed to the west of the Samoan Islands and caused flooding, as well as widespread wind damage within American Samoa. Significant damage was also reported in Western Samoa.[7]
See also
References
- Dirk H.R. Spennemann, Conservation management and mitigation of the impact of tropical cyclones
- Tonga – History
- "Tonga in the News". Archived from the original on 2010-09-25. Retrieved 2013-07-06.
- James P. Terry (2007). Tropical cyclones: climatology and impacts in the South Pacific. Springer. p. 111. ISBN 978-0-387-71542-1. Retrieved 2011-02-24.
- Britton, Neil R. "Efficient Australian relief system needs pre-disaster backing" (PDF). AODRO newsletter. Australian Overseas Disaster Response Organisation. 4 (2). ISSN 0812-3039. Retrieved September 26, 2015.
- Britton, Neil R (1987). "Disaster in the South Pacific: Impact of tropical cyclone "Nomu" on the Solomon Islands, May 1986". Disasters. 11 (2). doi:10.1111/j.1467-7717.1987.tb00627.x. (subscription required)
- Storm Data and Unusual Weather Phenomena: February 1982 (PDF) (Report). 24. United States National Climatic Data Center. p. 13. Archived from the original (PDF) on July 12, 2020. Retrieved July 12, 2020.