1980 Puerto Rican general election
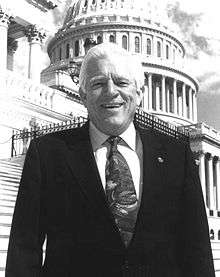
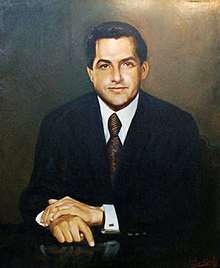
General elections were held in Puerto Rico on 4 November 1980.[1] Carlos Romero Barceló of the New Progressive Party (PNP) was re-elected Governor. In the House of Representatives elections the PNP received a plurality of votes, but the Popular Democratic Party won a majority of the seats. They also won a majority of seats in the Senate. Voter turnout was 88.30%.[2]
| |||||||||||||||||
| Turnout | 88.30% | ||||||||||||||||
|---|---|---|---|---|---|---|---|---|---|---|---|---|---|---|---|---|---|
| |||||||||||||||||
 Election results map. Blue denotes municipalities won by Barceló, and red denotes those won by Colón. | |||||||||||||||||
| |||||||||||||||||
 |
|---|
| This article is part of a series on the politics and government of Puerto Rico |
|
Constitution and law
|
|
|
Results
Governor
| Candidate | Party | Votes | % |
|---|---|---|---|
| Carlos Romero Barceló | New Progressive Party | 759,926 | 47.2 |
| Rafael Hernández Colón | Popular Democratic Party | 756,889 | 47.0 |
| Rubén Berríos Martínez | Puerto Rican Independence Party | 87,272 | 5.4 |
| Luis Lausell Hernández | Puerto Rican Socialist Party | 5,224 | 0.3 |
| Invalid/blank votes | 10,479 | – | |
| Total | 1,619,790 | 100 | |
| Registered voters/turnout | 1,835,160 | 88.3 | |
| Source: Nohlen | |||
Resident Commissioner
| Candidate | Party | Votes | % |
|---|---|---|---|
| Baltasar Corrada del Río | New Progressive Party | 760,484 | 47.71 |
| José Arsenio Torres | Popular Democratic Party | 749,531 | 47.02 |
| Marta Font de Calero | Puerto Rican Independence Party | 83,911 | 5.26 |
| Invalid/blank votes | – | ||
| Total | 1,593,926 | 100 | |
| Registered voters/turnout | 2,017,777 | ||
| Source: Nohlen | |||
House of Representatives
| Party | Votes | % | Seats | +/- |
|---|---|---|---|---|
| New Progressive Party | 47.2 | 25 | –8 | |
| Popular Democratic Party | 47.0 | 26 | +8 | |
| Puerto Rican Independence Party | 5.8 | 0 | 0 | |
| Puerto Rican Socialist Party | 0 | 0 | ||
| Invalid/blank votes | 8,125 | – | – | – |
| Total | 1,619,790 | 100 | 51 | 0 |
| Registered voters/turnout | 2,071,777 | 78.2 | – | – |
| Source: Nohlen | ||||
Senate
| Party | Votes | % | Seats | +/- |
|---|---|---|---|---|
| Popular Democratic Party | 15 | +2 | ||
| New Progressive Party | 12 | –2 | ||
| Puerto Rican Independence Party | 0 | 0 | ||
| Invalid/blank votes | – | – | – | |
| Total | 27 | 0 | ||
| Source: Nohlen | ||||
gollark: It's basically an advert, which I already do not like, unclosable (allegedly a bug, but who knows), and is whinily trying to shove political views at people.
gollark: I still do not like such things.
gollark: Honestly, I find websites shoving annoying notices about political views in your face very bees.
gollark: I haven't seen it since I haven't refreshed.
gollark: If I saw that I would probably inspect-element it out, since I use browser discord.
References
- Nohlen, D (2005) Elections in the Americas: A data handbook, Volume I, p552 ISBN 978-0-19-928357-6
- Nohlen, p553
This article is issued from Wikipedia. The text is licensed under Creative Commons - Attribution - Sharealike. Additional terms may apply for the media files.

