1977 Cumbria County Council election
Elections to Cumbria County Council were held on 5 May 1977. This was on the same day as other UK county council elections. The whole council of 82 members was up for election and the Conservative Party retained control of the council, which had previously been under no overall control.
| |||||||||||||||||||||||||||||||||
All 82 seats of Cumbria County Council 42 seats needed for a majority | |||||||||||||||||||||||||||||||||
|---|---|---|---|---|---|---|---|---|---|---|---|---|---|---|---|---|---|---|---|---|---|---|---|---|---|---|---|---|---|---|---|---|---|
| |||||||||||||||||||||||||||||||||
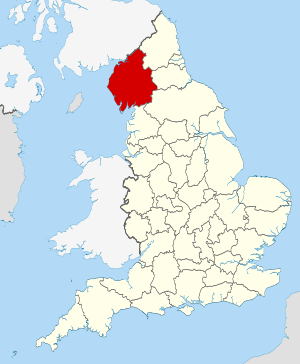 The County of Cumbria within England | |||||||||||||||||||||||||||||||||
| |||||||||||||||||||||||||||||||||
Results
| Party | Seats | Gains | Losses | Net gain/loss | Seats % | Votes % | Votes | +/− | |
|---|---|---|---|---|---|---|---|---|---|
| Conservative | 52 | 63.4 | 52.1 | 76,439 | |||||
| Labour | 23 | 28.0 | 36.7 | 53,892 | |||||
| Independent | 7 | 8.5 | 9.2 | 13,506 | |||||
| Liberal | 0 | 0.0 | 2.0 | 2,927 | |||||
gollark: Which is projecting a giant forcefield.
gollark: It also wouldn't WORK as the thing causing the problem is my FORCEFIELD GENERATOR.
gollark: Please DON'T TNT the plot.
gollark: I have a script which copies the Technic mods to a multiMC instance.
gollark: The ones you stuck in random places outside of the proper cable areas.
References
- "Local Election Summaries 1977". The Elections Centre. Retrieved 15 October 2019.
| County councils (England) |
|
|---|---|
| County councils (Wales) |
|
| Unicameral area | |
| District councils (Scotland) |
|
| District councils (Northern Ireland) |
|
| Sui generis |
|
| Cumbria County Council | |
|---|---|
| Allerdale Borough Council | |
| Barrow-in-Furness Borough Council | |
| Carlisle City Council | |
| Copeland Borough Council | |
| Eden District Council | |
| South Lakeland District Council | |
| Cumberland County Council |
|
| Westmorland County Council |
|
| |
This article is issued from Wikipedia. The text is licensed under Creative Commons - Attribution - Sharealike. Additional terms may apply for the media files.