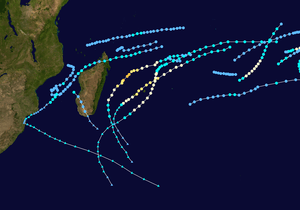
1965–66 South-West Indian Ocean cyclone season
The 1965–66 South-West Indian Ocean cyclone season was an average cyclone season.
| 1965–66 South-West Indian Ocean cyclone season | |
|---|---|
 Season summary map | |
| Seasonal boundaries | |
| First system formed | August 15, 1965 |
| Last system dissipated | May 1, 1966 |
| Seasonal statistics | |
| Total fatalities | 3 |
| Total damage | Unknown |
Systems
Unknown Storm Anne
| Tropical depression (SSHWS) | |
  | |
| Duration | August 15 – August 15 |
|---|---|
| Peak intensity | 45 km/h (30 mph) (1-min) |
Anne existed on August 15.
Tropical Disturbance Brenda
| Tropical disturbance (MFR) | |
| Tropical depression (SSHWS) | |
  | |
| Duration | August 16 – August 18 |
|---|---|
| Peak intensity | 45 km/h (30 mph) (10-min) |
Brenda existed from August 16 to August 18.
Tropical Cyclone Alice
| Category 1 tropical cyclone (Australian scale) | |
| Category 1 tropical cyclone (SSHWS) | |
  | |
| Duration | December 1 – December 5 |
|---|---|
| Peak intensity | 65 km/h (40 mph) (10-min) 998 hPa (mbar) |
Alice existed from December 1 to December 5.
Moderate Tropical Storm Claude
| Moderate tropical storm (MFR) | |
| Tropical storm (SSHWS) | |
  | |
| Duration | December 24 – January 10 |
|---|---|
| Peak intensity | 75 km/h (45 mph) (10-min) |
Claude existed from December 24 to January 10.
Tropical Cyclone Carol-Daisy
| Category 1 tropical cyclone (Australian scale) | |
| Category 1 tropical cyclone (SSHWS) | |
  | |
| Duration | January 1 (entered basin) – January 2 |
|---|---|
| Peak intensity | 65 km/h (40 mph) (10-min) 997 hPa (mbar) |
Carol-Daisy entered the basin on January 1 and dissipated the next day.
Tropical Cyclone Denise
| Tropical cyclone (MFR) | |
| Category 2 tropical cyclone (SSHWS) | |
  | |
| Duration | January 2 – January 11 |
|---|---|
| Peak intensity | 140 km/h (85 mph) (10-min) |
On January 7, Cyclone Denise passed north of Mauritius, producing wind gusts of 170 km/h (110 mph). Later, the storm crossed over Réunion, dropping record rainfall. Over a 24-hour period, Denise dropped 1,825 mm (71.9 in) of rainfall at Foc Foc, Réunion, of which 1,144 mm (45.0 in) fell over 12 hours; both precipitation totals are the highest recorded worldwide for their respective durations. Over 48 hours, precipitation totaled 2,230 mm (88 in) at Bras Sec. The heavy rains caused flooding that killed three people, and caused severe road and crop damage.[1][2][3]
Tropical Cyclone 13S
| Category 1 tropical cyclone (Australian scale) | |
| Tropical storm (SSHWS) | |
  | |
| Duration | January 11 – January 13 |
|---|---|
| Peak intensity | 75 km/h (45 mph) (10-min) 995 hPa (mbar) |
13S existed briefly from January 11 to January 13.
Unknown Storm 17S
| Tropical depression (SSHWS) | |
  | |
| Duration | January 16 – January 19 |
|---|---|
| Peak intensity | 45 km/h (30 mph) (1-min) |
17S existed from January 16 to January 19.
Tropical Disturbance Evelyn
| Tropical disturbance (MFR) | |
  | |
| Duration | January 19 – January 20 |
|---|---|
| Peak intensity | 45 km/h (30 mph) (10-min) |
Evelyn existed from January 19 to January 20.
Tropical Disturbance Francine
| Tropical disturbance (MFR) | |
  | |
| Duration | January 31 – February 1 |
|---|---|
| Peak intensity | 45 km/h (30 mph) (10-min) |
Francine existed from January 31 to February 1.
Tropical Depression Germaine
| Tropical depression (MFR) | |
  | |
| Duration | February 14 – February 17 |
|---|---|
| Peak intensity | 55 km/h (35 mph) (10-min) |
Germaine existed from February 14 to February 17.
Tropical Depression Hilary
| Tropical depression (MFR) | |
  | |
| Duration | February 20 – February 23 |
|---|---|
| Peak intensity | 55 km/h (35 mph) (10-min) |
Hilary existed from February 20 to February 23.
Intense Tropical Cyclone Ivy
| Intense tropical cyclone (MFR) | |
  | |
| Duration | March 3 – March 12 |
|---|---|
| Peak intensity | 165 km/h (105 mph) (10-min) |
Ivy existed from March 3 to March 12.
Unknown Storm Martha-Judith
  | |
| Duration | March 3 (entered basin) – March 7 |
|---|---|
| Peak intensity | Winds not specified |
Judith was the tenth cyclone of the season.
Unknown Storm Nancy-Kay
  | |
| Duration | March 17 – March 29 |
|---|---|
| Peak intensity | Winds not specified |
Unknown Storm Nellie
| Tropical storm (SSHWS) | |
  | |
| Duration | March 23 (entered basin) – March 24 (exited basin) |
|---|---|
| Peak intensity | 95 km/h (60 mph) (1-min) 989 hPa (mbar) |
Tropical Depression Lily
| Tropical depression (MFR) | |
  | |
| Duration | April 22 – May 1 |
|---|---|
| Peak intensity | 55 km/h (35 mph) (10-min) |
Lily existed from April 22 to May 1.
See also
References
- Chris Landsea. "Subject: E4) What are the largest rainfalls associated with tropical cyclones?". Frequently Asked Questions. Hurricane Research Division. Retrieved February 16, 2019.
- "1966 Denise" (in French). Meteo France. Retrieved February 16, 2019.
- Tropical Storm Denise, 2–11 March. National Climatic Data Center (Report). Global tropical/extratropical cyclone climatic atlas. 1996. Retrieved February 16, 2019.