0
I have a constructed a pivot table, where a single column Field is filled with dates, and I would like to do a comparison between subsets of values in only this particular column.
So let's say Column C contains a range of dates from 1st of Jan to present date. I've grouped them (right-click the column in the pivot table -> Groups) so that it counts how many entries there are for each date rather than counting the total number of entries. For instance, having 5 entries for 01.01.15 now shows up as "1st Jan: 5"
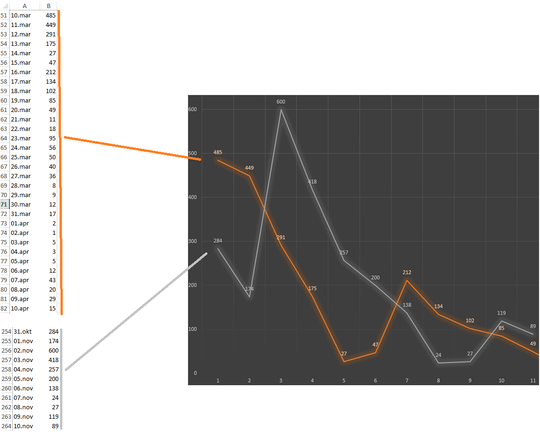
What I now want to do is add a diagram based on this column, where it shows how many entries there are for a given month with one line, and another line where it shows the same data for a different month. The result should let the reader do a visual comparison of how many entries there are for a given date these 2 months.
The graph on this screenshot is hacked together using manually made intermediate tables, which isn't really what I want - I want to do it straight out of the table, because I would potentially want to do it for many different periods:
Can this be done the way my pivot table is setup now? Even better, can this be achieved for two arbitrarily defined timeperiods?

What do you mean "grouped"? And are you working with pivot tables or pivot charts? A screenshot of what you have vs what you want might be helpful. – Raystafarian – 2015-11-10T18:30:00.273
Updated the question, I hope this is clearer. – Vegard – 2015-11-11T13:22:29.977