3
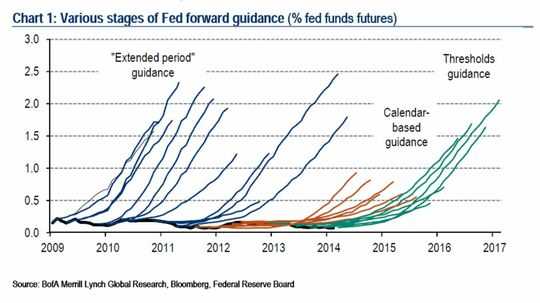
I'm trying to do up a chart (on excel), the chart that I have in mind is somewhat similar to the attached picture.
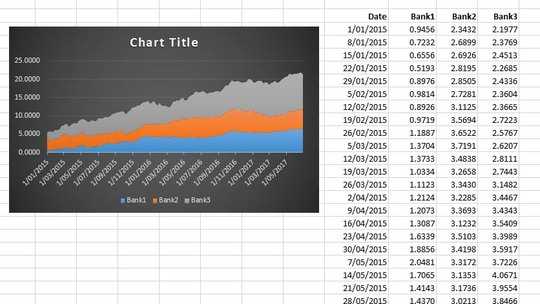
Data:
- X-axis: dates (weekly data)
- Y-axis: interest rates
Doing this, I can easily create an area chart.
Thereafter, I need to extend each data point on the chart. say on 24 June 2015, I need to do a 2 year forecast.
How should I arrange my excel data to replicate something similar?


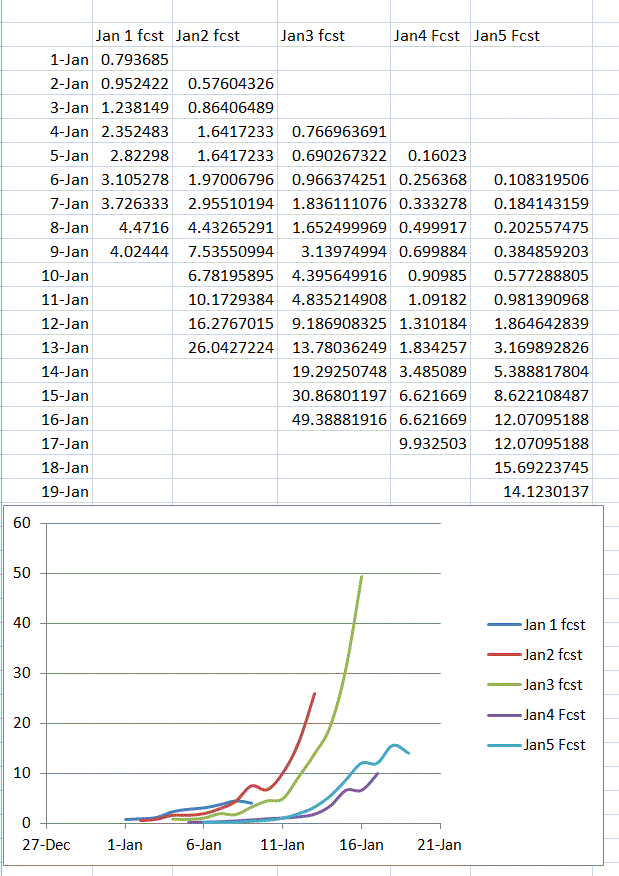
Good morning, to better illustrate my point, please see a sample picture (pardon me for my horrible drawings)
https://drive.google.com/file/d/0B6O4-X3A00XZX2RBX0owUjlCYUU/view?usp=sharing
this is somewhat tricky, the blue lines are the projection / forecast Basically, i need to incorporate the data in this manner.
I deeply appreciate any feedback or advice
http://www.zerohedge.com/sites/default/files/images/user3303/imageroot/2014/03/20140309_fwd.png – Cedric Yang – 2015-07-28T23:38:49.113