3
I have the following really strange problem and hope, you guys can help me out. If there are any questions, I'll try answer them as best as i can.
The problem
I have a web server with Debian 6.0, Apache 2.2.16 and PHP 5.3.9. Unfortunately, there is no way upgrading these components.
From time to time, HTTP-Requests to the server are interrupted in the middle of the loading of the page. Its always something around 3 minutes (its variable between 180 and 195 seconds). The scripts just stops, without any hint, and doesn't send any output back to the client nor does server-side actions.
The test case
To clarify the problem, take a look at the following test script, with wich I could reproduces the problem. Notice that the problem happens on many scripts on that server, which are running longer then 3 minutes.
<?php
    echo "Start: ".date('Y-m-d H:i:s')."<br>\n";
    flush(); ob_flush();

    $count = 0;
    while ($count++ < 300) {
        sleep(1);
        echo ".";
        flush(); ob_flush();
    }

    echo "<br>\nFinished: ".date('Y-m-d H:i:s');
It runs 5 minutes and outputs a dot every second. To reproduce the problem, I open it in 3 different browsers (Chrome, Firefox, IE) with 2 different domains, so that the scripts runs 6 times. I start the script in each window around 1 second delayed of each other.
What happens
If the problem happens, I can only see around 180 dots, but relative to some absolute time point. So if the first script started at 10:00:00, the second script started at 10:00:02 and the third script started at 10:00:03, then the first script outputted 186 dots, the second script 184 dots and the third script 183 dots. That means, that all scripts started at different times, but ended at exactly 10:03:06.
I also tried this script with file_put_contents(), so I can see, if the scripts just doesn't send output to the client anymore. But even this stops, so the whole php script has to be killed server side and doesn't execute anymore.
What I also noticed is that the problem doesn't happen allways. Sometimes I have to do the experiment the half day to see the effect, sometimes it happens on the first try. Also when it happens, it will mostly happen in all 6 windows, but not always. Sometimes, the first two windows finish fine after 5 minutes, and the other 4 windows have stopped at around 3 minutes.
I looked at the tcpdump of the traffic between server and client. The server sends a "FIN, ACK" right when no more output is being sent.
The apache access.log just shows the starts of the script, in the error.log nothing related to the problem or to the times, where the problem occures, exists.
Conclusion
First, it looks like the requests to the server or the load is relevant, because I can see the problem more often at times, where many people (70) are using the server and where many cronjobs are running.
Perhaps its some kind of network overload, so that the network crashes and kills all connections. But why does it happen, that sometimes 2 out of 4 windows finish loading the script while the others don't?
I also thought of being caused by some cronjob (there are too many of them on the server), who kills too old apache scripts every x minutes. But I could not find one nor would this not explain, why it happens (when it happens) every time at round about 3 minutes. Also, more older apache processes from other users still run and are not being killed.
I exclude the problem being on client side, because I can watch the problem on different clients with different OS and different browsers.
Thanks
I hope I was able to describe my problem good enough for you, so you could give me tips, how I can better analyse, where the problem is and how I can fix it (without having to upgrade essential parts of the server). Perhaps its just some mysterious setting somewhere?
Thank you all for reading to the end!
Fun fact: If no output is done at a script, that runs longer than 3 minutes (because calculating something f.e.) and the problem happens, Firefox mostly thinks "hey, no output but finished? Lets reload the script!", and rarely thinks "hey, no output but finished? I'll show the user an empty response message". Great, if some important action is behind this script and this action is getting executed again and again and again g
Facts through your comments
access.log is only written, if requests finishes. If it cancles in the middle of loading, no access.log entry is existing.
Failing processes are getting a SIGKILL.
 Starting the test scripts every 10 seconds. Time varies from 3 minutes to open end (mostly between 3 und 4 minutes). Whats interesting: mostly 12 of the started scripts are killed.
Tests through your comments
Started few seconds after each other:
chrome_backoffice: Start: 2015-06-11 09:41:46 (cancled at 09:44:56)
..............................................................................................................................................................................................
NO ACCESS LOG ENTRY

chrome_server: Start: 2015-06-11 09:41:49 (cancled at 09:44:56)
...........................................................................................................................................................................................
NO ACCESS LOG ENTRY

firefox_server: Start: 2015-06-11 09:41:51 (cancled at 09:44:56)
.........................................................................................................................................................................................
NO ACCESS LOG ENTRY

firefox_backoffice: Start: 2015-06-11 09:41:52 (cancled at 09:44:56)
........................................................................................................................................................................................
NO ACCESS LOG ENTRY

ie_backoffice: Start: 2015-06-11 09:41:53 (cancled at 09:44:56)
.......................................................................................................................................................................................
NO ACCESS LOG ENTRY

ie_server: Start: 2015-06-11 09:41:56 (cancled at 09:44:56)
....................................................................................................................................................................................
NO ACCESS LOG ENTRY
Started one minute after each other:
chrome_backoffice: Start: 2015-06-11 09:46:17
............................................................................................................................................................................................................................................................................................................
Finished: 2015-06-11 09:51:17
###DOMAIN###:443 192.168.###IP### - - [11/Jun/2015:09:46:17 +0200] "GET /###PATH###/sleepTest.php HTTP/1.1" 200 2174 "-" "Mozilla/5.0 (Windows NT 6.1; WOW64) AppleWebKit/537.36 (KHTML, like Gecko) Chrome/41.0.2272.89 Safari/537.36"

chrome_server: Start: 2015-06-11 09:47:17
............................................................................................................................................................................................................................................................................................................
Finished: 2015-06-11 09:52:17
###DOMAIN###:80 192.168.###IP### - - [11/Jun/2015:09:47:17 +0200] "GET /###PATH###/sleepTest.php HTTP/1.1" 200 2174 "-" "Mozilla/5.0 (Windows NT 6.1; WOW64) AppleWebKit/537.36 (KHTML, like Gecko) Chrome/41.0.2272.89 Safari/537.36"

firefox_backoffice: Start: 2015-06-11 09:48:17 (cancled at 09:52:23)
......................................................................................................................................................................................................................................................
NO ACCESSLOG ENTRY

firefox_server: Start: 2015-06-11 09:50:55
............................................................................................................................................................................................................................................................................................................
Finished: 2015-06-11 09:55:55
###DOMAIN###:80 192.168.###IP### - - [11/Jun/2015:09:50:55 +0200] "GET /###PATH###/sleepTest.php HTTP/1.1" 200 2172 "-" "Mozilla/5.0 (Windows NT 6.1; WOW64; rv:38.0) Gecko/20100101 Firefox/38.0"

ie_backoffice: Start: 2015-06-11 09:50:57
............................................................................................................................................................................................................................................................................................................
Finished: 2015-06-11 09:55:57
###DOMAIN###:443 192.168.###IP### - - [11/Jun/2015:09:50:57 +0200] "GET /###PATH###/sleepTest.php HTTP/1.1" 200 2173 "-" "Mozilla/5.0 (Windows NT 6.1; WOW64; Trident/7.0; rv:11.0) like Gecko"

ie_server: Start: 2015-06-11 09:50:56
............................................................................................................................................................................................................................................................................................................
Finished: 2015-06-11 09:55:56
###DOMAIN###:80 192.168.###IP### - - [11/Jun/2015:09:50:56 +0200] "GET /###PATH###/sleepTest.php HTTP/1.1" 200 2173 "-" "Mozilla/5.0 (Windows NT 6.1; WOW64; Trident/7.0; rv:11.0) like Gecko"
Started 30 seconds after each other:
chrome_backoffice: Start: 2015-06-11 09:56:36 (cancled at 10:00:00)
............................................................................................................................................................................................................
NO ACCESSLOG ENTRY

chrome_server: Start: 2015-06-11 09:57:06
............................................................................................................................................................................................................................................................................................................
Finished: 2015-06-11 10:02:06
###DOMAIN###:80 192.168.###IP### - - [11/Jun/2015:09:57:06 +0200] "GET /###PATH###/sleepTest.php HTTP/1.1" 200 2177 "-" "Mozilla/5.0 (Windows NT 6.1; WOW64) AppleWebKit/537.36 (KHTML, like Gecko) Chrome/41.0.2272.89 Safari/537.36"

firefox_backoffice: Start: 2015-06-11 09:57:36
............................................................................................................................................................................................................................................................................................................
Finished: 2015-06-11 10:02:36
###DOMAIN###:443 192.168.###IP### - - [11/Jun/2015:09:57:36 +0200] "GET /###PATH###/sleepTest.php HTTP/1.1" 200 2177 "-" "Mozilla/5.0 (Windows NT 6.1; WOW64; rv:38.0) Gecko/20100101 Firefox/38.0"

firefox_server: Start: 2015-06-11 09:58:06
............................................................................................................................................................................................................................................................................................................
Finished: 2015-06-11 10:03:06
###DOMAIN###:80 192.168.###IP### - - [11/Jun/2015:09:58:06 +0200] "GET /###PATH###/sleepTest.php HTTP/1.1" 200 2177 "-" "Mozilla/5.0 (Windows NT 6.1; WOW64; rv:38.0) Gecko/20100101 Firefox/38.0"

ie_backoffice: Start: 2015-06-11 09:58:39
............................................................................................................................................................................................................................................................................................................
Finished: 2015-06-11 10:03:39
###DOMAIN###:443 192.168.###IP### - - [11/Jun/2015:09:58:39 +0200] "GET /###PATH###/sleepTest.php HTTP/1.1" 200 2177 "-" "Mozilla/5.0 (Windows NT 6.1; WOW64; Trident/7.0; rv:11.0) like Gecko"

ie_server: Start: 2015-06-11 09:59:08
............................................................................................................................................................................................................................................................................................................
Finished: 2015-06-11 10:04:08
###DOMAIN###:80 192.168.###IP### - - [11/Jun/2015:09:59:08 +0200] "GET /###PATH###/sleepTest.php HTTP/1.1" 200 2177 "-" "Mozilla/5.0 (Windows NT 6.1; WOW64; Trident/7.0; rv:11.0) like Gecko"
Another test case:
Automatic script on the server, which starts the above test script every 10 seconds. The test scripts updates its status in a MySQL table. If it finishes, the column "end" is filled. Otherwise the "progress" column has the date of the last second, where the script was still running.
https://jsfiddle.net/v8boufn8/
strace on a failed process:
[...]
--- SIGCHLD (Child exited) @ 0 (0) ---
write(22, "\0", 1)                      = -1 EAGAIN (Resource temporarily unavailable)
rt_sigreturn(0x16)                      = 0
close(42)                               = 0
wait4(22231, [{WIFEXITED(s) && WEXITSTATUS(s) == 0}], 0, NULL) = 22231
poll([{fd=41, events=POLLIN|POLLPRI}], 1, 0) = 0 (Timeout)
write(41, "\1\0\0\0\16", 5)             = 5
read(41, "\7\0\0\1\0\0\0\2\0\0\0", 16384) = 11
poll([{fd=41, events=POLLIN|POLLPRI}], 1, 0) = 0 (Timeout)
write(41, "\v\0\0\0\2*********", 15)   = 15
read(41, "\7\0\0\1\0\0\0\2\0\0\0", 16384) = 11
poll([{fd=41, events=POLLIN|POLLPRI}], 1, 0) = 0 (Timeout)
write(41, "D\3\0\0\3UPDATE `*******`.`*********"..., 840) = 840
read(41, "0\0\0\1\0\1\0\2\0\0\0(Rows matched: 1  Cha"..., 16384) = 52
rt_sigprocmask(SIG_BLOCK, [CHLD], [], 8) = 0
rt_sigaction(SIGCHLD, NULL, {0x7f423be749d0, [], SA_RESTORER|SA_NOCLDSTOP, 0x7f42509a7f60}, 8) = 0
rt_sigprocmask(SIG_SETMASK, [], NULL, 8) = 0
nanosleep({1, 0}, 0x7fff37f40790)       = 0
writev(40, [{"\27\3\1\0 A0\245\3059\204\365\311\356\334\261tu&\273\236\201e\321\243_\346h\324\226\335\217"..., 111}], 1) = 111
pipe2([42, 43], O_CLOEXEC)              = 0
clone(child_stack=0, flags=CLONE_CHILD_CLEARTID|CLONE_CHILD_SETTID|SIGCHLD, child_tidptr=0x7f425144ea10) = 22439
close(43)                               = 0
fcntl(42, F_SETFD, 0)                   = 0
fstat(42, {st_mode=S_IFIFO|0600, st_size=0, ...}) = 0
read(42, "0.99\n", 8192)                = 5
read(42, "", 8192)                      = 0
--- SIGCHLD (Child exited) @ 0 (0) ---
write(22, "\0", 1)                      = -1 EAGAIN (Resource temporarily unavailable)
rt_sigreturn(0x16)                      = 0
close(42)                               = 0
wait4(22439, [{WIFEXITED(s) && WEXITSTATUS(s) == 0}], 0, NULL) = 22439
poll([{fd=41, events=POLLIN|POLLPRI}], 1, 0) = 0 (Timeout)
write(41, "\1\0\0\0\16", 5)             = 5
read(41, "\7\0\0\1\0\0\0\2\0\0\0", 16384) = 11
poll([{fd=41, events=POLLIN|POLLPRI}], 1, 0) = 0 (Timeout)
write(41, "\v\0\0\0\2**********", 15)   = 15
read(41, "\7\0\0\1\0\0\0\2\0\0\0", 16384) = 11
poll([{fd=41, events=POLLIN|POLLPRI}], 1, 0) = 0 (Timeout)
write(41, "D\3\0\0\3UPDATE `*******`.`*********"..., 840) = 840
read(41, "0\0\0\1\0\1\0\2\0\0\0(Rows matched: 1  Cha"..., 16384) = 52
rt_sigprocmask(SIG_BLOCK, [CHLD], [], 8) = 0
rt_sigaction(SIGCHLD, NULL, {0x7f423be749d0, [], SA_RESTORER|SA_NOCLDSTOP, 0x7f42509a7f60}, 8) = 0
rt_sigprocmask(SIG_SETMASK, [], NULL, 8) = 0
nanosleep({1, 0},  <unfinished ...>
+++ killed by SIGKILL +++
strace on a successful process:
[...]
munmap(0x7f424a7e7000, 1078264)         = 0
munmap(0x7f424a8ef000, 1128872)         = 0
munmap(0x7f4251346000, 1080672)         = 0
close(14)                               = 0
munmap(0x7f423759c000, 67108864)        = 0
close(28)                               = 0
close(38)                               = 0
munmap(0x7f423e2cf000, 2570696)         = 0
munmap(0x7f423c074000, 2463760)         = 0
write(22, "@", 1)                       = -1 EAGAIN (Resource temporarily unavailable)
close(22)                               = 0
close(21)                               = 0
rt_sigaction(SIGCHLD, {SIG_DFL, [], SA_RESTORER|SA_NOCLDSTOP, 0x7f42509a7f60}, {0x7f423be749d0, [], SA_RESTORER|SA_NOCLDSTOP, 0x7f42509a7f60}, 8) = 0
munmap(0x7f423bc61000, 4270440)         = 0
munmap(0x7f423b95f000, 3152520)         = 0
munmap(0x7f423b6f8000, 2517800)         = 0
munmap(0x7f423b59c000, 1425296)         = 0
munmap(0x7f4237203000, 3770008)         = 0
munmap(0x7f4236e74000, 3731272)         = 0
munmap(0x7f423683a000, 1280128)         = 0
munmap(0x7f4235cc6000, 6166888)         = 0
munmap(0x7f424af2d000, 2645224)         = 0
munmap(0x7f424ac19000, 3223576)         = 0
munmap(0x7f424aa03000, 2186232)         = 0
close(9)                                = 0
close(8)                                = 0
exit_group(0)                           = ?

Wulf
Posted 2015-06-11T06:04:01.360
Reputation: 315

What do the apache logs tell you? So the script is killed, but apache keeps running? What happens if you run script 2 one minute after script 1, and script 3 two minutes later? – SPRBRN – 2015-06-11T07:25:20.930
I just ran 3 tests (see edited question with output). Access.log does only have an entry if the requests finishes successfully. Otherwise it has no entry. error.log does not contain any relevant entries at the time of failing. Yes, apache keeps running fine for many days. – Wulf – 2015-06-11T08:25:19.130
So if you start 6 processes at the same time, it fails. When you start 6 processes over time, at one point one will fail. What happens when you start 10 or 20 processes over time? What happens with the server? Do other pages open normally? Try
toporhtopfor feedback on memory use. What happens if you run one process for a long time? Isn't this a normal server timeout? Why don't you put these long-running scripts in a queue and run them as cron script? – SPRBRN – 2015-06-11T10:22:54.297You probably have max_execution_time set to three minutes.
– David Schwartz – 2015-06-11T10:23:43.2631max_execution_time in my php.ini is set to 10830. Also that would not explain, why scripts fail at the same time independent of their starting time, and not each one after x seconds, and only sometimes. But thanks for your answer! – Wulf – 2015-06-11T10:46:50.070
@SPRBRN: Mostly they will fail. Sometimes, only 4 out of 6 fail. Sometimes they dont fail at all. As I wrote perhaps it has something to do with the usage of the server by all users and the cronjobs who run at a time. I'll try it with 10 requests and come back to you soon. Yes, other pages open normally, the users can use the server as expected. If I run one script for a long time, sometimes it crashes after ~3 minutes, sometimes it runs a hour without crash. It is a production environment, where I only can see this problem. Changing the scripts would not resolve the main problem, just hide it – Wulf – 2015-06-11T11:04:40.217
Yep, and thats the point. I already edited the most important scripts where a fail would cause real trouble, but it can still happen on many other scripts. A fix of the primary problem would be the best, but it is hard to identify. Thanks for your help anyway, SPRBRN. I update this thread if I have any new information. P.S. Currently the problem doesn't occure. I now have a automatic script which will call the testscript every 5 minutes and save the result. Perhaps I can see, why the problem only occures sometimes... – Wulf – 2015-06-11T12:39:01.550
I remember a problem we had with a local test webserver that restarted every month and we had no idea what could cause it. It turned out to be a problematic UPS that did a test and cut off power, and we didn't monitor the UPS properly. Your Apache keeps running, but can it be that something else stops this script, maybe even restarts Apache, like a Monit script? If you manually restart Apache, will that have the same results? In that case, the PID will change, and you should be able to see that. – SPRBRN – 2015-06-11T12:40:07.720
I thought about something like this too. The main apache process is running since the last restart of it (over a week ago) and some apache child processes are running since yesterday also. But it really seems like something in this direction. – Wulf – 2015-06-11T12:42:07.630
Practical approach: design a script that assumes the process will be killed, so make it fail proof. And you can wait two days and give this question a 50 point bonus. – SPRBRN – 2015-06-11T14:40:29.420
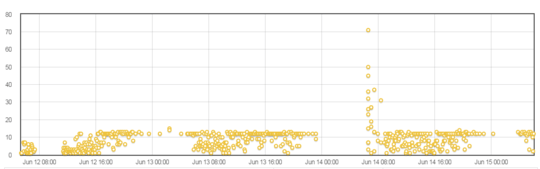
Interesting fact I found out today: https://jsfiddle.net/v8boufn8/ In this table you can see, when the scripts crash (end-column is empty, time of crash in progress-column). If you combine the crashed progress-dates with the following start-date, these scripts are somehow linked (id 389: crash at 08:12:23 => id 408: started at 08:12:25, crashed at 08:15:32 => id 427: started at 08:15:35, crashed at 08:18:54 (and also the 2 following requests)). Since 09:21:23 the problem didn't occure anymore. What could be the reason for this regularity?
– Wulf – 2015-06-12T08:22:20.847Could it be something like apache's mod_security clearing used sockets, thinking they're being monopolized by some DoS activity ? – mveroone – 2015-06-12T08:31:22.877
Does the "kill" times match anything stated in the cron log ? (/ver/log/cron usually) ? Have you tried to
strace -p <pid>the php script until you run over the actual improper kill/stop ? – mveroone – 2015-06-12T08:34:33.723@Kwaio: I couldn't find mod_security in our apache config, so I guess its not the case. The kill times don't match any cronjobs regulary. The
stracewas a really good tip! In an failing process, the output ends with:nanosleep({1, 0}, <unfinished ...> +++ killed by SIGKILL +++while in a success request the script does many ending things and just outputsexit_group(0)What can be the cause for this? – Wulf – 2015-06-12T13:17:03.393