0
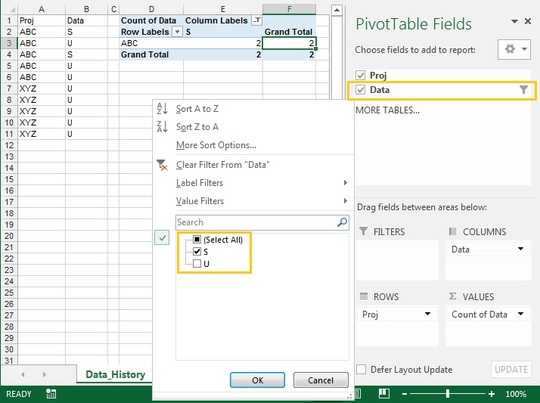
Below is a simple representation of a huge data and its pivot table
Data
+------+------+
| Proj | Data |
+------+------+
| ABC  | S    |
| ABC  | U    |
| ABC  | S    |
| ABC  | U    |
| ABC  | U    |
| XYZ  | U    |
| XYZ  | U    |
| XYZ  | U    |
| XYZ  | U    |
| XYZ  | U    |
+------+------+
When we apply pivot table to this data,
Coulumn Label - Proj
Row Label - Data
Value - Data
We get,
+-------+---+---+-------+
| Proj  | S | U | Total |
+-------+---+---+-------+
| ABC   | 2 | 3 |     5 |
| XYZ   |   | 5 |     5 |
| Total | 2 | 8 |    10 |
+-------+---+---+-------+
How can we show below result,
using combination of value filters and label filters on column labels
and without using row label filters (it wont be feasible as original data has too many row label)
+-------+---+---+-------+
| Proj  | S | U | Total |
+-------+---+---+-------+
| ABC   | 2 | 3 |     5 |
| Total | 2 | 3 |     5 |
+-------+---+---+-------+
Thanks!

OT5
Posted 2015-03-06T16:27:37.320
Reputation: 1

What is your criteria for only having ABC in your results? It seems arbitrary that you drop XYZ from the results and then state that you can't actually filter out XYZ (or anything but ABC). – JNevill – 2015-03-06T21:48:25.323
Actual goal is to filter the pivot table to get project names which have S associated to it. Here, as XYZ is only associated with U, it needs to be filtered out. However, I cant just filter according to row as the actual data has too many projects to select individually in a row filter. So, I am looking for a way to use some combination of value and label filters. – OT5 – 2015-03-08T00:21:33.423
@OT5 If you want your question moved to a different site in the network, please "flag" it for moderator attention and request migration. – a CVn – 2015-03-20T14:10:49.880