1
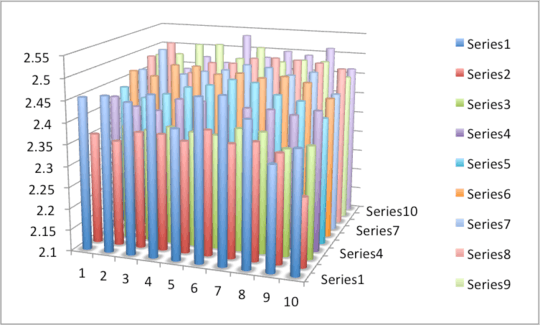
My data is in multiple dimensions, as below. Rather than a trendline, I guess I need a trendplane. Is this possible in Excel or a similar tool?

Adam_G
Posted 2015-02-24T13:39:25.173
Reputation: 162
1
My data is in multiple dimensions, as below. Rather than a trendline, I guess I need a trendplane. Is this possible in Excel or a similar tool?
Adam_G
Posted 2015-02-24T13:39:25.173
Reputation: 162
1
Excel does not have 3D fitting capability. But XLSurfFit, a third party Excel addin can do it pretty easily: http://3dexcel.com/excel-3d-surface-equation-fittinng/

Dan
Posted 2015-02-24T13:39:25.173
Reputation: 11
1
I don't know if you can do a best fit based on 3D data but you can do a best fit based on each series and then create a 3D surface based on that. Is it acceptable to have it be in a different chart? Smashing a surface on top of an already busy 3D chart would probably be bad UI anyway. First, here's what my final sheet looks like:
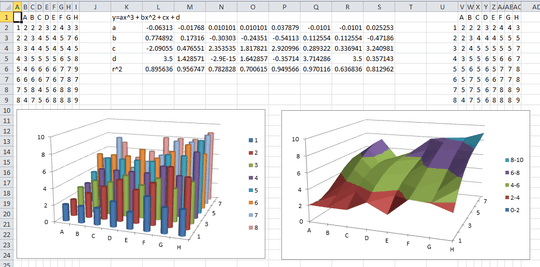
I used a 3rd degree polynomial fit such that the surface would be of the form y = ax^3 + bx^2 + cx + d. Based on your data, you may want more or less but you can adapt this proof-of-concept to fit your need. Here's the formulas for the cells L2:L6:
=INDEX(LINEST(B$2:B$9,$A$2:$A$9^{1,2,3},1,0),1)
=INDEX(LINEST(B$2:B$9,$A$2:$A$9^{1,2,3},1,0),2)
=INDEX(LINEST(B$2:B$9,$A$2:$A$9^{1,2,3},1,0),3)
=INDEX(LINEST(B$2:B$9,$A$2:$A$9^{1,2,3},1,0),4)
=INDEX(LINEST(B$2:B$9,$A$2:$A$9^{1,2,3},1,1),3,1)
If you wanted a second degree polynomial, the array would be {1,2} and the row_num parameter for the INDEX function would only go up to 3. These formulas need to be dragged out to the right so that you get a fit for each series. Finally, you can create a second table that calculates this best fit for each point. The formula for cell V2 is:
=L$2*$U2^3+L$3*$U2^2+L$4*$U2+L$5
... and that gets dragged down and over. Create a 3D surface chart based on that data and you're done.

Engineer Toast
Posted 2015-02-24T13:39:25.173
Reputation: 3 019
0
Source Change the display of a 3-D chart
Create a 3-D chart
On the worksheet, select the cells that contain the data that you want to use for the chart.
On the Insert tab, in the Charts group, do one of the following:
To create a 3-D column chart, click Column, and then under 3-D Column, click 3-D Column.
To create a 3-D cylinder chart, click Column, and then under Cylinder, click 3-D Cylinder.
To create a 3-D cone chart, click Column, and then under Cone, click 3-D Cone.
To create a 3-D pyramid chart, click Column, and then under Pyramid, click 3-D Pyramid.
To create a 3-D line chart, click Line, and then under 3-D Line, click 3-D Line.
To create a 3-D area chart, click Area, and then under 3-D Area, click 3-D Area.
To create a 3-D surface chart, click Other Charts, and then under Surface, click 3-D Surface or Wireframe 3-D Surface.
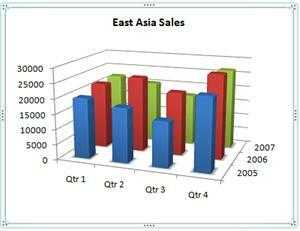
Example:
See also XYZ 3D-chart in Excel, 3D-histogram in Excel , 3 axis chart and excel 3d bar chart for more information.

DavidPostill
Posted 2015-02-24T13:39:25.173
Reputation: 118 938
Thanks, but how do I get the higher dimensional trend? – Adam_G – 2015-02-24T14:10:35.137
Trendlines cannot be added to 3D charts in Excel :/ I've not been able to find an addon for this ... – DavidPostill – 2015-02-24T15:20:13.880
Interesting. But this doesn't give me a 2-dimensional trendline/trendplane, does it? – Adam_G – 2015-02-24T14:59:35.953
1It's giving you a 2D trendline for each series and then your presenting that group of trendlines as a surface. It's not perfect but I don't know an easy way in Excel to calculate a best fit point based on points all around it in 3D space instead of just those in a series. – Engineer Toast – 2015-02-24T15:06:08.457