3
I've got a spreadsheet that has several columns that hold the same type of data (a list of average measurements). They're separated into different columns as each on represents a slightly different measurement.
I have a need to plot a scatter graph of the data in several of these columns as if they were concatenated into one single column and were one range. Simply CTRL+clicking multiple columns seems to create three ranges separated by commas and doesn't give the expected result on the graph (it seems to treat them as three distinct sets of data rather than combining them into one).
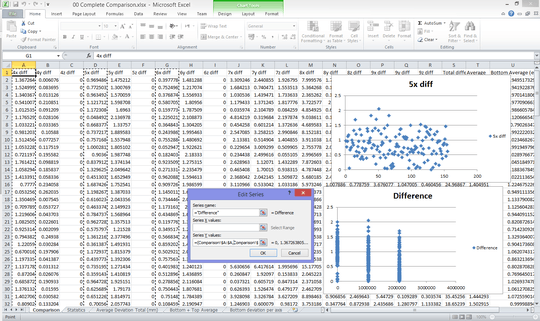
Here's an example of what I mean. The graph on the top right was created simply by setting the series name, leaving the series X-values blank and then selecting a single column for the series y-values. This creates that scatter graph I expect.
I then try to do the same thing for the graph in the bottom right, except I CTRL+click three columns for the series y-values. Unfortunately, it looks completely different (I don't really understand how it's representing the data and where it's getting those x-values from).
Is it possible to have multiple ranges treated as a single continuous range in formulae?

Amr Bekhit
Posted 2014-12-27T22:17:43.793
Reputation: 227

1If it is a scatter chart with only point markers (no lines), the only thing that should distinguish the different "variables" is the marker symbol (and the legend would show three entries). You can change the marker symbol so they all match and remove the legend. If this is not what you're looking for, can you clarify the desired result or post a screen shot and describe what's wrong with that result? – fixer1234 – 2014-12-27T22:44:38.447
1The problem is probably that you need to specify the X values (another name for scatter chart is XY chart). Enter each set as a separate data series, specifying X and Y values so the chart displays all three series. If you select all of the Y columns at once, edit the series definitions to specify the X values. Then you can play with the marker symbols if you want them to match. – fixer1234 – 2014-12-27T23:17:33.313
Thanks that sounds like a reasonable workaround. Perhaps you could write it up as an answer? If I don't get any other suggestions, I'll mark yours as the answer. – Amr Bekhit – 2014-12-27T23:19:32.497