How can I hide 0% value in data labels in an Excel Bar Chart

5

2

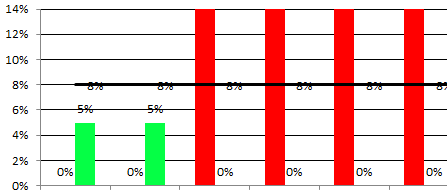
I would like to hide data labels on a chart that have 0% as a value. I can get it working when the value is a number and not a percentage. I could delete the 0% but the data is going to change on a daily basis.

I am doing a if statement to calculate which column to put the data into.Data is shown below enter image description here

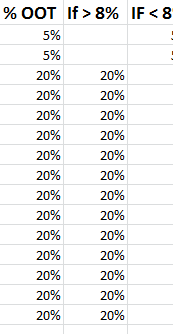
I have 2 bars one green and one red. When the value is above 8% the red bar shows and when the value is below 8%. At one time i can only show one bar. I would like to hide the 0% as the bar isnt being show.

enter image description here

Inkey

Posted 2014-09-03T10:22:23.193

Reputation: 161

You must have two columns for the data to show like this. In your source data, create a statement that if the result is zero to replace it with "#N/A" – wbeard52 – 2014-09-03T13:48:13.237

Answers

10

The quick and easy way to accomplish this is to custom format your data label.

  1. Select a data label.
  2. Right click and select Format Data Labels
  3. Choose the Number category in the Format Data Labels dialog box.
  4. Select Custom in the Category box.
  5. In the format code box, enter 0%;-0%; and click Add.
  6. Close out of your dialog box and your 0% labels should be gone.

This works because Excel looks to your custom format to see how to format Postive;Negative;0 values. By leaving a blank after the final ;, Excel formats any 0 value as a blank.

dav

Posted 2014-09-03T10:22:23.193

Reputation: 8 378

1Note that this doesn't help if you want to have your labels also include Category/Series name in addition to the values (not the case for OP but I was looking to do this and it looks like I will not be able to). – Dan Henderson – 2016-02-16T19:58:39.927

2

If using Office 2013 or later, type the format as mentioned above by Dav and Erik combined, i.e.

  1. Select a data label.
  2. Right click and select Format Data Labels
  3. Choose the Number category in the Format Data Labels dialog box.
  4. Select Custom in the Category box.
  5. In the format code box, enter 0%;-0%; "" and click Add.
  6. After this, select the newly added format in the Type box.
  7. Close out of your dialog box and your 0% labels should be gone.

Ever Neel

Posted 2014-09-03T10:22:23.193

Reputation: 21

0

You can also set the =NA() value in your empty Cells.

robert

Posted 2014-09-03T10:22:23.193

Reputation: 196

1The chart shows #N/A – Inkey – 2014-09-03T12:38:22.220

I was thinking more for the data-values than the labels. – robert – 2014-09-03T12:39:06.120