1
Got an interesting problem that seemed trivial at first...
I have a table in the following format:
USER | QUESTION | ANSWER
========================
1    | 1        | A
1    | 2        | B
1    | 3        | D
2    | 1        | A
2    | 2        | B
2    | 3        | A
3    | 1        | B
3    | 2        | A
3    | 3        | D
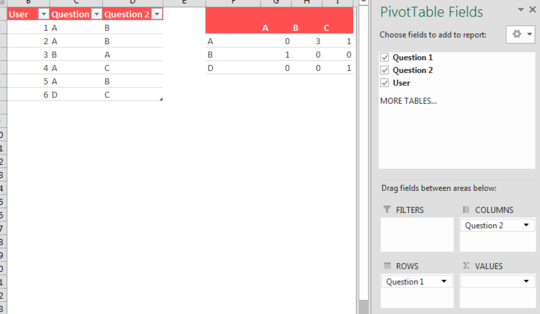
I am trying to generate a pivot table that looks something like:
             | QUESTION (2)
-------------+---+---+---+---
QUESTION (1) | A | B | C | D
-------------+---+---+---+---
           A | 0 | 2 | 0 | 0
           B | 1 | 0 | 0 | 0
           C | 0 | 0 | 0 | 0
           D | 0 | 0 | 0 | 0
That is, semantically, "people who answered question A with answer B and also answered question X with answer Y", for each possible answer.

azz
Posted 2014-06-27T13:35:15.240
Reputation: 123

Thanks. So it's not possible to do lookups via the USER field? – azz – 2014-06-27T14:38:17.817
@DerFlatulator, you could build a matrix out of vlookups but it would be clunky and fixed; you'd have to rebuild it if you added more data or questions. These options are dynamic and reliable, and require very little computing power because they don't rely on volatile functions that refresh whenever anything changes. – CLockeWork – 2014-06-27T14:45:34.720
So current plan is to change the server PHP code to generate CSV files in the format you specified. However could you give a pointer if I needed to go with VLOOKUPs instead? – azz – 2014-06-27T15:04:52.767
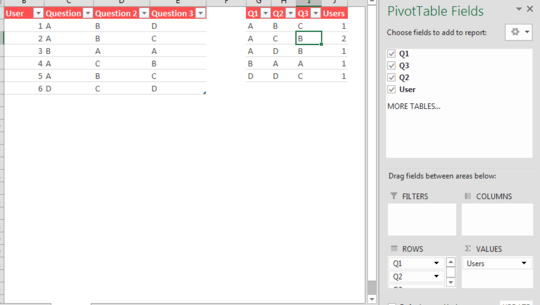
Thinking about it, VLOOKUPS wouldn't work; you'd need to use COUNTIFS instead. You would need to build a matrix with COUNTIFS that say something along the lines of
– CLockeWork – 2014-06-27T15:25:09.573count the User column if Q1 = A and Q2 = A and Q3 = A, and then makes a different version for every combination! Plus COUNTIFS don't work in older versions of Excel. Basically you're best shot at doing what you need is with the pivot tables. Sorry I can't be of more help.Awesome. Just got it all together (using the first method mentioned). Thanks muchly. – azz – 2014-06-27T16:13:58.340
You're very welcome :) – CLockeWork – 2014-06-27T16:31:11.947