6
I'm trying to create a line chart in Excel with the following values from my sheet:
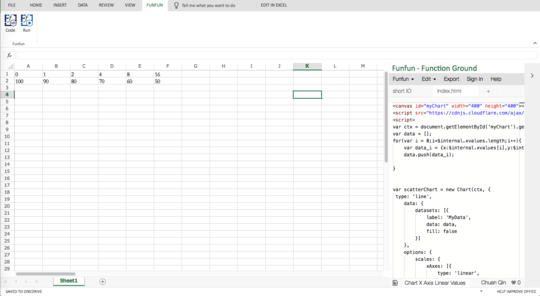
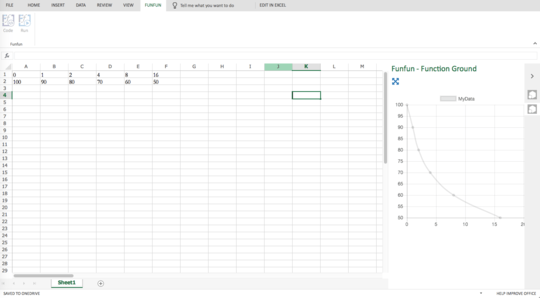
(0,100) (1,90) (2,80) (4,70) (8,60) (16,50)
The problem I can't work around is that I want the 0, 1, 2, 4, 8, 16 to be both labels on the x-axis of my chart as well as the values (i.e., the 4 should be twice the distance from 0 as the 2, the 8 twice the 4, etc.).
When I create the chart in Excel all x-axis values are equally spread.
Is this even possible in Excel?


Another ancient post : are you pulling these out for a publicity or marketing drive??? – Solar Mike – 2017-12-10T13:53:49.757
Hi Mike, I just added a disclose to the answer :) It is indeed an ancient post and with more than 4000 views. I wanted to show my solution (perhaps another possibility) to people who may have similar problems. And I also wrote specific and working JavaScript codes (as people may write VBA code) to answer this specific question.
– Chuan Qin – 2017-12-10T14:54:07.903