3
1
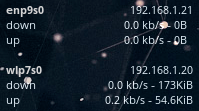
So I just setup conky on my arch box for monitoring various stats on the desktop, and I'm having a small problem. The relevant text in my conky config:
down $alignr ${downspeedf enp9s0} kb/s - ${totaldown enp9s0}
up $alignr ${upspeedf enp9s0} kb/s - ${totalup enp9s0}
where enp9s0 is my gigabit wired connection. I noticed that conky is always showing zeroes though for up/down speeds and totals for just this interface. I have another two lines in the config that do the same thing for my wireless interface (wlp7s0) and it works fine.
To see what's happening, I checked the output of ifconfig and it's showing zeroes for everything:
enp9s0: flags=4163<UP,BROADCAST,RUNNING,MULTICAST>  mtu 1500
        inet 192.168.1.21  netmask 255.255.255.0  broadcast 192.168.1.255
        inet6 fe80::7a45:c4ff:feb7:4471  prefixlen 64  scopeid 0x20<link>
        ether -----------------  txqueuelen 1000  (Ethernet)
        RX packets 0  bytes 0 (0.0 B)
        RX errors 0  dropped 0  overruns 0  frame 0
        TX packets 0  bytes 0 (0.0 B)
        TX errors 0  dropped 0 overruns 0  carrier 0  collisions 0
        device interrupt 17
But it's showing stats as normal for my wireless interface:
wlp7s0: flags=4163<UP,BROADCAST,RUNNING,MULTICAST>  mtu 1500
        inet 192.168.1.20  netmask 255.255.255.0  broadcast 192.168.1.255
        inet6 fe80::86a6:c8ff:feaf:85c5  prefixlen 64  scopeid 0x20<link>
        ether ----------------  txqueuelen 1000  (Ethernet)
        RX packets 649  bytes 207876 (203.0 KiB)
        RX errors 0  dropped 0  overruns 0  frame 0
        TX packets 119  bytes 56765 (55.4 KiB)
        TX errors 0  dropped 0 overruns 0  carrier 0  collisions 0
Relevant lsmod lines:
alx                    27461  0
mdio                    3525  1 alx
Relevant lspci -vv:
09:00.0 Ethernet controller: Qualcomm Atheros AR8161 Gigabit Ethernet (rev 10)
    Subsystem: Dell Device 057e
    Control: I/O+ Mem+ BusMaster+ SpecCycle- MemWINV- VGASnoop- ParErr- Stepping- SERR- FastB2B- DisINTx-
    Status: Cap+ 66MHz- UDF- FastB2B- ParErr- DEVSEL=fast >TAbort- <TAbort- <MAbort- >SERR- <PERR- INTx-
    Latency: 0, Cache Line Size: 64 bytes
    Interrupt: pin A routed to IRQ 49
    Region 0: Memory at f7800000 (64-bit, non-prefetchable) [size=256K]
    Region 2: I/O ports at d000 [size=128]
    Capabilities: <access denied>
    Kernel driver in use: alx
    Kernel modules: alx
Does anyone know what's going on? It's not a crippling issue - internet access works just fine - it just doesn't seem to be measuring stats as it does with my wireless interface.
EDIT: I've disabled the wireless interface to make sure it wasn't just using wireless over wired (I'm not exactly versed in how linux manages multiple network interfaces) and it still wasn't showing any stats when using the wired interface solely even though I still had internet access.

Brandon
Posted 2013-08-20T17:30:55.973
Reputation: 173

I have exactly the same problem since I updated form kernel 3.8 + hand-compiled compat-drivers to the 3.10.6 kernel with included alx drivers. – Patkos Csaba – 2013-08-29T15:29:50.140