How can rearrange my columns to rows in Excel?

1

It is a bit complicated to describe in words, but I am making a literature review and I need to map how often certain theories are used within certain themes or topics. I currently have a table like this in Excel:
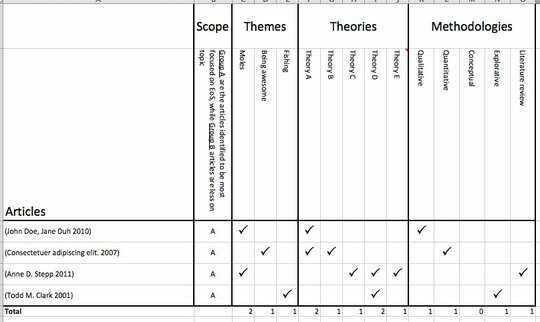
get from this

And I would like to rearrange my data, so each column represent a theme and each row represent a theory, while the matrix is showing a count of how many times a specific theory occurs within a certain theme (sorry, I should probably have filled some numbers into the table to illustrate counting the theories).
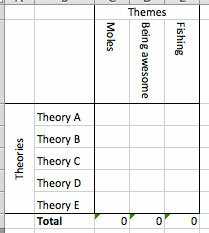
to this

My best bet is that I should do some sort of "conditional counting" and count theories if and only if there is also a cross in a certain theme, but I can't really figure out how to do this in practice.

I have also included the original excel-file, so you can play around with it: Excel file

funkylaundry

Posted 2013-03-06T20:16:15.750

Reputation: 185

Answers

1

The source matrix you show in your question is not too helpful. as it leaves out one vital constraints - that any paper could actually support multiple theories. However, looking at your file, I see that you have this all included in a nice (and to formulas much more useful) list.

Therefore, all you need is this formula in cell B2 of your result map:

=SUMPRODUCT(--('Raw Data A'!$E:$E=B$1),--ISNUMBER(FIND($A2,('Raw Data A'!$H:$H))))

In case a paper could also cover multiple themes, use this formula:

=SUMPRODUCT(--(ISNUMBER(FIND(B$1,'Raw Data A'!$E:$E)),--ISNUMBER(FIND($A2,('Raw Data A'!$H:$H))))

Peter Albert

Posted 2013-03-06T20:16:15.750

Reputation: 2 802

Thanks a lot! It did the trick! ...just had to remember changing the font to something readable, rather than wingdings :) – funkylaundry – 2013-03-07T01:31:23.387

0

I can't view your original spreadsheet, and I'm not sure how you're implementing checkmarks (with a checkmark character in the font...?), but you should be able to do this with a pivot table regardless. Worst case you can come up with a custom number format that translates a 1 into a checkmark at the format level and a 0 into a blank, so that the pivot table can sum up the 1s.

Look up a tutorial on pivot tables; there are videos, websites, howto guides, books, every format imaginable. Understanding simple data aggregation that is possible through pivot tables will make you much more productive, and once you understand the concepts, you'll find reasons to implement pivot tables in other things that you do, so they aren't just useful for this one project.

allquixotic

Posted 2013-03-06T20:16:15.750

Reputation: 32 256

Thanks, I just tried making a Pivot-table. Never really understood the concept - probably because I did not need it, but I see how powerful it could be in this setting. However, I would need to change the way data is stored in the 'raw data' tab, as I have multiple theories comma separated in the same cell at the moment, so data is not 'atomic'. – funkylaundry – 2013-03-07T01:33:47.297