0
I am trying to make an Excel Workbook that contains the statistics of an XBox Tournament that our office is doing. Winner of the whole Tournament wins the XBox! It's fairly simple rules. Everyone will play everyone in a game of horseshoes. The winner of the Horseshoes round will earn 10 points.
There will be two other games where the employees can earn points. However, I would like to focus on just the horseshoes for now.
The total of the points will determine the winner of the Tournament.
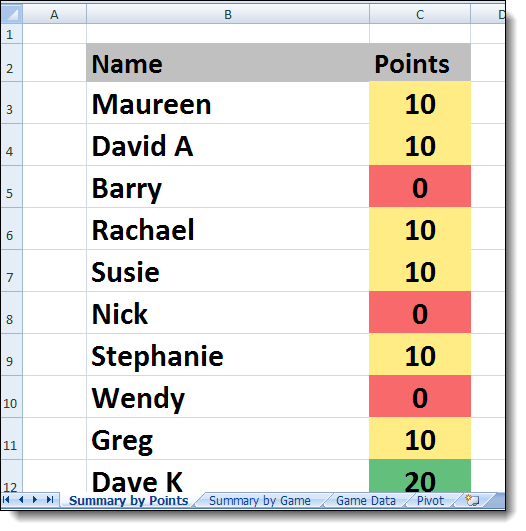
I have 4 tabs. The first tab is an overall summary of the game.
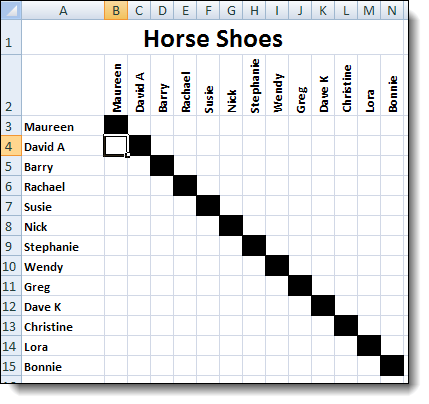
The second tab is a grid showing who has played who. This is where I will need some assistance. I would like the Workbook to automatically fill out an X next to those who have already played each other.
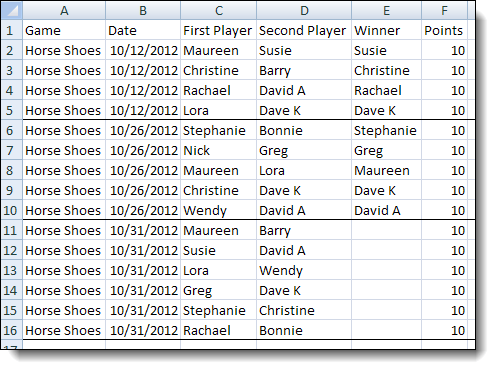
The third tab is the raw data that is manually entered.
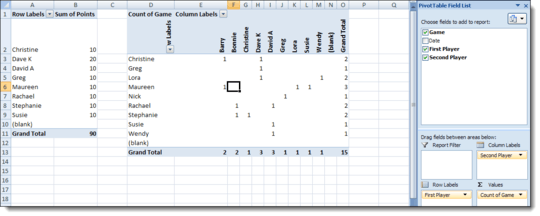
The fourth tab is my calculations tab that has a few pivot tables. As you can see from the second pivot table, it technically has the data that I need for the Summary by Game tab. However, I'm at a little loss how I can transpose the data from the pivot table to a user friendly grid.

kobaltz
Posted 2012-10-30T14:43:23.307
Reputation: 14 361

Had to change a small bit of your answer, but this worked nicely. I was trying to make it too complicated with vlookups. Wasn't the right function for the task. Kudos. – kobaltz – 2012-10-30T18:44:29.037