How to tell excel to ignore #NUM! errors in plotting a line chart?

4

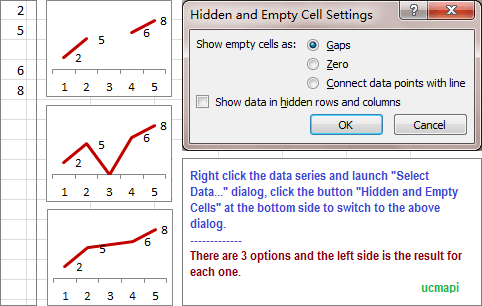
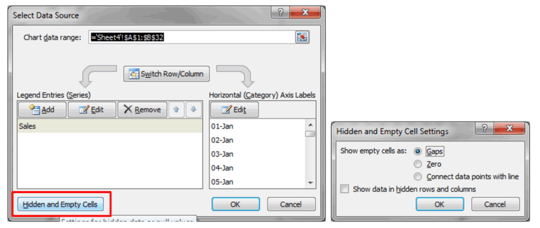
I am plotting a line chart which is a time series. After a certain period of time, the time series shows #NUM! How can I get excel to ignore the #NUM! and plot nothing. Currently, it plots all values of #NUM! as zero which makes my chart inaccurate.

daysandtimes

Posted 2012-09-27T14:14:38.140

Reputation: 147

Answers

3

Consider using =IFERROR(A1,NA()). This will replace all error values with NA(), which Excel will automatically skip giving you a gap.

dav

Posted 2012-09-27T14:14:38.140

Reputation: 8 378

3NA() or #N/A does not leave a gap. It prevents drawing a marker, but if the other points are connected by a line, Excel draws a line between the points on either side of the #N/A. – Jon Peltier – 2012-11-27T20:48:35.347

5

You can setup a graph to handle missing data, but not to handle faultive data.

http://www.ucmapi.com/chart/017/gap.png

So, to solve this you should protect your time-series with a code like:

B1=IFERROR(A1;"")

Whereby A1 would be your "raw" data and B1 is the cell/column which you will have to use as chart-input.

enter image description here

Jook

Posted 2012-09-27T14:14:38.140

Reputation: 1 745

how do i get to hidden and empty cell settings? – daysandtimes – 2012-09-27T14:49:50.733

choose 'select data source' or so, after a right-click into your chart, then the button at the lft-bottom – Jook – 2012-09-27T14:53:09.560

4"" is interpreted by Excel as text, and is assigned a value of zero. If you don't want a point at zero, use NA() in the formula instead of "". This puts the ugly #N/A into the cell, but it is not plotted with a point. If the points are connected by lines, a line is drawn connecting the points on either side of the #N/A. – Jon Peltier – 2012-11-27T20:50:07.513